
Consolidated financial statements
Consolidated balance sheet on 31-12-2022
| Amounts x €1,000 | Ref. | 31-12-2022 | 31-12-2021 | ||
|---|---|---|---|---|---|
| ASSETS | |||||
| Intangible fixed assets | 5.1 | 134,910 | 140,940 | ||
| Investments | 5.2 | ||||
| Real estate | 521,889 | 672,637 | |||
| Participations | 4,464 | 3,999 | |||
| Other financial investments: | |||||
| - Shares and other variable income securities | 1,792,117 | 2,968,913 | |||
| - Bonds and other fixed-income securities | 2,226,270 | 2,695,781 | |||
| - Derivatives | 64,574 | - | |||
| - Mortgage loans | 163,879 | 192,457 | |||
| - Other loans | 243,278 | 359,668 | |||
| - Real estate funds | 1,891,058 | 1,345,465 | |||
| - Infrastructure funds | 1,002,657 | 554,968 | |||
| - Agricultural and forestry funds | 103,686 | - | |||
| - Mortgage funds | 298,979 | 209,616 | |||
| - Investments in cash and cash equivalents | 72,667 | 64,057 | |||
| - Other financial investments | 10,894 | 12,644 | |||
| 8,396,412 | 9,080,205 | ||||
| Receivables | 5.3 | 191,267 | 87,211 | ||
| Other assets | 5.4 | ||||
| Real estate in own use | 96,116 | 99,580 | |||
| Other intangible assets | 26,025 | 26,198 | |||
| Inventory | 2,238 | 2,880 | |||
| 124,379 | 128,658 | ||||
| Accruals | |||||
| Accrued rent and interest | 1,164 | 1,189 | |||
| Accruals | 29,466 | 23,396 | |||
| 30,630 | 24,585 | ||||
| Cash and cash equivalents | 107,707 | 218,856 | |||
| TOTAL ASSETS | 8,985,305 | 9,680,455 |
| Amounts x €1,000 | Ref. | 31-12-2022 | 31-12-2021 | ||
|---|---|---|---|---|---|
| LIABILITIES | |||||
| Group equity | |||||
| Equity | 5.5, 5.7 | 1,037,582 | 1,778,413 | ||
| Minority interest | 5.6 | 3,164 | 3,229 | ||
| 1,040,746 | 1,781,642 | ||||
| Provisions | 5.8 | 9,631 | 206,885 | ||
| Technical provisions | 5.9 | 7,531,734 | 7,172,312 | ||
| Long-term liabilities | 5.11 | 168,559 | 171,239 | ||
| Short-term debts and accrued liabilities | 5.12 | 234,635 | 348,377 | ||
| TOTAL LIABILITIES | 8,985,305 | 9,680,455 |
Consolidated income statement for 2022
| Amounts x €1,000 | Ref. | 2022 | 2021 | ||
|---|---|---|---|---|---|
| Income | |||||
| Premium revenue | 6.1 | 669,011 | 592,472 | ||
| Gross investment result | 6.2 | -805,658 | 685,295 | ||
| Turnover funeral company | 6.1 | 191,776 | 156,521 | ||
| Other turnover | 6.1 | 39 | 3,236 | ||
| 55,168 | 1,437,524 | ||||
| Costs | |||||
| Underwriting costs | 6.3 | 437,829 | 389,374 | ||
| Acquisition costs | 6.4 | 17,746 | 15,294 | ||
| External costs funeral company | 148,860 | 137,084 | |||
| Personnel costs | 6.5 | 236,134 | 192,263 | ||
| Depreciations | 6.6 | 41,377 | 32,621 | ||
| Management costs investments | 6.2 | 35,809 | 38,875 | ||
| Other operational costs | 6.7 | 104,009 | 87,154 | ||
| 1,021,764 | 892,665 | ||||
| Group result from ordinary activities before interest and taxes | -966,596 | 544,859 | |||
| Interest | |||||
| Interest income | -335 | 594 | |||
| Interest expense | 4,494 | 5,202 | |||
| -4,829 | -4,608 | ||||
| Group result from ordinary activities before taxes | -971,425 | 540,251 | |||
| Profit sharing | 5.9 | 43,654 | 5,940 | ||
| Group result before taxes | -1,015,079 | 534,311 | |||
| Taxes | 6.10 | 273,801 | -99,625 | ||
| Minority interest result | 177 | 195 | |||
| Group result after taxes | -741,101 | 434,881 |
Consolidated statement of cashflows for 2022
| Amounts x €1,000 | Ref. | 2022 | 2021 | ||
|---|---|---|---|---|---|
| Result after taxes | 5.5 | -741,101 | 434,881 | ||
| Adjustments for: | |||||
| Changes in value of intangible fixed assets | 5.1 | 29,725 | 21,279 | ||
| Changes in value of tangible fixed assets | 5.4 | 11,652 | 11,379 | ||
| Depreciation of allocated acquisition costs | 5.9 | 15,771 | 13,736 | ||
| Addition technical provision | 5.9 | 343,651 | 267,988 | ||
| Changes in value of investments | 5.2 | 914,193 | -501,964 | ||
| Changes in value of minority interest | 5.6 | -177 | -195 | ||
| Other changes to equity | 5.5 | 270 | 281 | ||
| Changes to other provisions | 5.8 | -410,847 | 123,011 | ||
| Changes in other intangible assets | 5.4 | - | -28,809 | ||
| 904,238 | -93,294 | ||||
| Change in working capital: | |||||
| Changes in inventory | 642 | 50 | |||
| Changes in receivables | 5.3 | 109,537 | -50,848 | ||
| Changes in accrued assets | -6,319 | -9,249 | |||
| Changes in short-term debts | 5.12 | -32,220 | 184,215 | ||
| 71,640 | 124,167 | ||||
| 975,878 | 30,873 | ||||
| Total cashflow from operational activiites | 234,777 | 465,754 | |||
| Interest received | 274 | 150 | |||
| Interest paid | -1,550 | -1,697 | |||
| Corporate income tax | -79,972 | -46,760 | |||
| -81,248 | -48,307 | ||||
| Cashflow from operational activities | (a) | 153,529 | 417,447 | ||
| Investments and acquisitions | |||||
| - in intangible fixed assets | 5.1 | -23,695 | -23,492 | ||
| - in participations | 5.2 | - | -1,793 | ||
| - in real estate | 5.2 | -22,137 | -18,764 | ||
| - in loans and securities | 5.2 | -3,728,231 | -3,630,829 | ||
| - in other intangible assets | 5.4 | -11,552 | -11,752 | ||
| - in other financial investments | 5.2 | -288 | -228 | ||
| - in acquisition Yarden Holding BV | - | -1,402 | |||
| -3,785,903 | -3,688,260 |
Consolidated statement of cashflows for 2022, continued
| Amounts x €1,000 | Ref. | 2022 | 2021 | ||
|---|---|---|---|---|---|
| Disposals, payments and sales | |||||
| - in intangible fixed assets | 5.1 | - | 5,344 | ||
| - in participations | 5.2 | -465 | -13 | ||
| - in real estate | 5.2 | 129,669 | 102,345 | ||
| - in loans and securities | 5.2 | 3,391,052 | 3,210,476 | ||
| - in other intangible assets | 5.4 | 3,537 | 1,543 | ||
| - in other financial investments | 5.2 | - | - | ||
| 3,523,793 | 3,319,695 | ||||
| Cashflow from investment and fund activities | (b) | -262,110 | -368,565 | ||
| Cashflow minority interest | 5.6 | 112 | 213 | ||
| Payment and borrowing of long-term liabilities | 5.11 | -2,680 | -27,678 | ||
| Withdraw long-term liabilities | 5.11 | - | - | ||
| Cashflow from financing activities | (c) | -2,568 | -27,465 | ||
| Change in cash and cash equivalents on balance | (a)+(b)+(c) | -111,149 | 21,417 | ||
| Cash and cash equivalents on 1 January | 218,856 | 143,070 | |||
| Cash and cash equivalents received from acquisition Yarden Holding BV | - | 54,369 | |||
| Cash and cash equivalents on 31 December | 107,707 | 218,856 |
Notes on the consolidated balance sheet and income statement
1. General notes
1.1 Activities
The activities of DELA Coöperatie UA (‘DELA cooperative'), with its statutory office in Eindhoven, Oude Stadsgracht 1, CoC number 17012026, and its group companies (‘DELA Group’) involve insurance, investments and funeral services. The insurance products are funeral insurance, life insurance and savings plans. The insurance activities take place in the Netherlands, Belgium and Germany. The funeral services take place in the Netherlands and Belgium. Investment activities are managed centrally from the Netherlands.
1.2 Consolidation
DELA cooperative is at the head of a group of legal persons. The consolidation includes the financial data of the DELA cooperative, its group companies and other legal persons over which it has decisive control and central management. Group companies are legal persons over which DELA cooperative has decisive control, whether directly or indirectly, because it has the majority of the votes or can control the financial and operational activities in other ways. This takes into account potential voting rights that can be exercised directly on the balance sheet date.
The group companies and other legal persons over which DELA cooperative has decisive control or central management are included in the consolidation for 100 percent. The minority interest in the group equity and group result are stated individually.
In the event of an interest in a joint venture, this interest is consolidated proportionally. A joint venture is an agreement to cooperate in which the control is equally divided between the two shareholders.
Intercompany transactions, profits and mutual receivables and debts between group companies and other legal persons included in the consolidation are eliminated. Unrealised losses on intercompany transactions are also eliminated unless an impairment applies. Valuation principles of group companies and other legal persons included in the consolidation are adjusted where necessary to align them to the valuation principles applied by DELA Group.
As the income statement for DELA cooperative is included in the consolidated financial statements, the company-only financial statements only includes a reflection of an abridged income statement in accordance with Article 2:402 of the Dutch Civil Code (hereafter: DCC).
The organisational chart of the companies included in the consolidation of DELA Group is provided below. This chart includes the data required as of 31-12-2022 based on Articles 2:379 and 2:414 DCC.
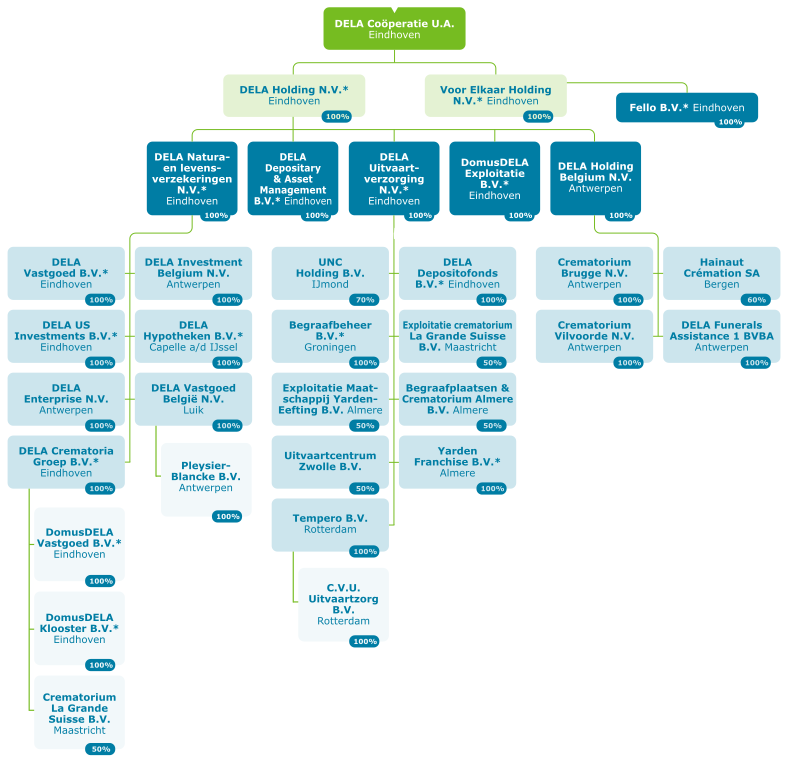
* DELA cooperative has guaranteed liabilities of these group companies as meant in article 2:403 DCC. This means they are exempt from the obligation to file as their figures are consolidated in this financial statements.
Paragraph 5.2 includes an overview of the participations that are not consolidated.
The following mergers and acquisitions had taken place in DELA Group in 2022:
- The sale and delivery of all shares in the capital of Yarden Uitvaartzorg BV and Yarden Uitvaartfaciliteiten BV by Yarden Holding BV to DELA Holding NV, followed by a merger between Yarden Uitvaartzorg BV and Yarden Uitvaartfaciliteiten BV as companies ceasing to exist and DELA Uitvaartverzorging NV as the acquiring company;
- The sale and delivery of 50 percent of the shares in the capital of Uitvaartcentrum Zwolle BV by Yarden Holding BV to DELA Uitvaartverzorging NV;
- The sale and delivery of all shares in the capital of Yarden Depositofonds BV by Yarden Holding BV to DELA Uitvaartverzorging NV, followed by a merger between Yarden Depositofonds BV as the company ceasing to exist and DELA Depositofonds BV as the acquiring company;
- The sale and delivery of all shares in the capital of Tempero BV by Yarden Holding BV to DELA Uitvaartverzorging NV;
- Mother-daughter merger between Yarden Holding BV as the company ceasing to exist and DELA Holding NV as the acquiring company;
- Merger between Yarden Vastgoed BV and Yarden Vastgoed II BV as companies ceasing to exist and DELA Crematoria Groep BV as the acquiring company;
- Merger between AB Crematorium DELA BV as the company ceasing to exist and DELA Crematoria Groep BV as the acquiring company;
- Merger between DELA Vastgoed Management B.V. as the company ceasing to exist and DELA Vastgoed B.V. as acquiring company.
All the aforementioned mergers and acquisitions were processed retroactively (1 January 2022) via the 'carry over accounting' method. The mergers and acquisitions in the group involve transactions with associated parties which are processed based on book value. These transactions were not based on standard market conditions.
The following transactions also took place in book year 2022:
- DELA Vastgoed België BV acquired and received all shares in the capital of the following entities in book year 2022: Immo JHL SRL, Les Fuérailles SRL, GHD Management SRL, Uitvaartverzorgning Van Tendeloo - Verhagen BV and Van Tendeloo BV. These entities also merged with DELA Vastgoed België BV in the year under review in accordance with the carry over accounting method.
- DELA Vastgoed België BV acquired and received all shares in the capital of Pleysier-Blancke BV in book year 2022.
- Yarden Holding B.V. has the interest in Sassen-Dielemans B.V. sold.
1.3 Related parties
Affiliated parties are all legal persons over which a company has decisive control, joint control or significant influence. This includes legal persons that have a controlling interest. The statutory Executive and Supervisory Board members, other key officials in the management of DELA Group and close affiliates are also considered affiliated parties.
Significant transactions with affiliated parties are clarified insofar as they did not apply under normal market conditions. Details related to the nature and scope of the transactions and other information required to provide insight will be provided where necessary. With regard to deaths reported for DELA Natura- en levensverzekeringen NV, the subsequent arrangements are in principle in the hands of DELA Uitvaartverzorging NV or its subsidiaries. Any costs are charged at regular transfer prices.
1.4 Acquisitions and disposals of group companies
The results and identifiable assets and liabilities of the acquired company are included in the consolidated financial statements from the acquisition date. The acquisition date is the moment that decisive control is gained over the acquired company.
The historical price consists of the monetary amount or equivalent that was agreed on for the acquisition of the acquired company plus any directly attributable costs. If the historical cost differs from the net amount of fair value of the identifiable assets and liabilities, the difference is considered as goodwill.
The companies included in the consolidation scope will remain in the consolidation until the decisive control is transferred or the company is only being held for onward sale.
1.5 Estimates
To apply the principles and rules for drawing up the financial statements, the Board must form an opinion on various matters and make estimates that may be essential to the figures included in the financial statements. If required in order to provide the insight as intended by Article 2:362 section 1 DCC, the nature of these opinions and estimates, including the associated suppositions, is included in the notes related to the relevant items. Although these estimates have been made by the Board to the best of their knowledge, the actual results may ultimately differ. The main estimates relate to:
- The valuation of investments: real estate, real estate funds, infrastructure funds and private equity firms (see section 5.2);
- The applied principle for the technical provision (see section 2.14);
- The value of the non-technical provisions (see section 2.12).
1.6 Comparative figures
The financial statements includes a change related to the presentation of the costs in the income statement. Up to and including book year 2021, part of the personnel and other operational costs (advertising and other sales costs) were attributed to the acquisition costs. The reason for the change is that the functional and categorial methods were both used in the presentation of the income statement. The impact on the presentation of the income statement over book year 2021 is shown below.
Change to the presentation of costs
| Amounts x €1,000 | Annual report 2022 | Annual report 2021 | |||
|---|---|---|---|---|---|
| Acquisition costs | 15,294 | 65,224 | |||
| Personnel costs | 192,263 | 171,861 | |||
| Other operating costs | 87,154 | 57,626 | |||
| Total | 294,711 | 294,711 |
An adjustment was also made to the comparative figures on the balance sheet in relation to the 2021 financial statements. It involves the deferred tax assets and liabilities, which should be offset. This was not the case in the 2021 financial statements and has been corrected in this year’s statement. Offsetting reduces the deferred tax assets and liabilities by €213,593 compared to the 2021 financial statements.
1.7 Drawing up and confirmation of the financial statements
The financial statements 2022 was drawn up by the Executive Board on 21 April 2023 and is due at the time of publication to be confirmed in the general meeting of 13 May 2023. The financial statements 2021 was adopted at the general meeting of 11 June 2022.
2. Principles for balance sheet and profit determination
2.1 General
The consolidated financial statements was drawn up in accordance with the statutory demands of Title 9 Book 2 DCC and the Dutch Accounting Standards for Annual Reporting (RJ). All amounts are provided in thousands unless indicated otherwise.
The valuation and determination of the results are based on historical costs unless indicated otherwise. Revenue and costs are assigned to the year to which they occur. Profits are only included insofar as they were realised on the balance sheet date unless indicated otherwise. Obligations and any losses that originated before the end of the reporting year are taken into account insofar as they were known when the financial statements was drawn up.
2.2 Foreign currency
2.2.1 Functional currency
The items in the financial statements of the group companies are valued in compliance with the currency of the economic environment in which the group companies carry out the majority of their activities (the functional currency). The euro is the functional and performance currency of DELA Group.
2.2.2 Conversion of foreign currency
Transactions in foreign currencies during the reporting period are processed in the financial statements at the exchange rate on the transaction date. Assets and liabilities in foreign currency that are valued at their current value are converted at the exchange rate on the balance sheet date. Exchange rate differences that occur in the settlement of monetary items are processed in the income statement in the period in which they occur.
Assets valued in foreign currency at the historical cost are converted at the exchange rate (or the approximate exchange rate) on the transaction date.
2.3 Reinsurance contracts
DELA Group is compensated for losses on issued insurance contracts by contracts made with reinsurers.
Reinsurance premiums, provisions and payments as well as technical provisions for reinsurance contracts are accounted for in the same way as the direct insurance to which the reinsurance applies. The share of reinsurers in the technical provision to which DELA Group is entitled as a result of its reinsurance contracts is subtracted from the gross technical provision. Short-term receivables from reinsurers are included under Receivables.
The valuation of amounts due from or payable to reinsurers takes place in accordance with the conditions of the reinsurance contracts. The obligations related to reinsurance mainly involve future premiums.
Receivables due to reinsurance contracts are assessed on the balance sheet date for any impairments.
2.4 Intangible fixed assets
The intangible fixed assets are valued at the amount of the incurred costs, minus the cumulative depreciations and, where applicable, impairments. The economic useful lives and depreciation method are reassessed at the end of the book year and the depreciation terms are reviewed if any significant changes are detected. A statutory reserve is established for the costs of internal development, equivalent to the value of the capitalised amount.
To determine whether an impairment applies to an intangible fixed asset, we refer to Paragraph 2.8.
2.4.1 Goodwill
Any paid goodwill for acquisitions is valued at fair value at the time of acquisition. This value is determined based on the sum that would have been paid between independent parties who are well-informed and willing to make the relevant transaction. The goodwill is depreciated linearly based on the expected economic lifespan, which is assessed annually. The current expected lifespan of various goodwill positions is between 20 years and 30 years.
2.4.2. Acquired insurance portfolioss
The future cashflows from acquired insurance portfolios are valued at fair value determined at the time of acquisition. This value is determined based on the sum that would have been paid between independent parties who are well-informed and willing to make the relevant transaction, and it is depreciated linearly based on the expected economic lifespan, which is assessed annually. The current expected lifespan for acquired insurance portfolios is 20 years, calculated from the acquisition date.
2.4.3 Concessions and permits
Costs of concessions and permits are valued at the historical cost, and depreciated linearly over the expected future period of use with a maximum of 20 years.
2.5 Investments
The principle for valuation and result determination per investment category is described below. The majority of the investments are valued at the fair value. Any further clarification of the fair value required is provided in section 5 in the notes on the balance item. Both unrealised and realised profits and losses due to the sale and value change of investment areaccounted for in the income statement. Transaction costs related to the purchase sale of investments are directly accounted for in the income statement.
2.5.1 Real estate
Real estate is valued at the fair value on the balance sheet date. Value changes (if cumulatively positive) are processed in the revaluation reserve via the income statement, taking deferred tax into account. Section 5.2 provides further details on the valuation method.
2.5.2 Participations
Participations in which a significant influence applies are valued in accordance with the net asset value method. A legal presumption of significant influence occurs when 20 percent or more of the votes can be cast.
The net asset value method is calculated in accordance with the principles that apply to this financial statements; for participations for which insufficient data is available to change these principles, the valuation principles of the relevant participation are applied.
A participation that is valued as negative in accordance with the net asset value method is valued at nil. If and insofar as DELA Group is partially or fully responsible for the debts of the participation, a provision will be made. The initial valuation of participations is based on fair value of the identifiable assets and liabilities at the time of acquisition. From then on, the principles related to this financial statements apply, based on the value at initial valuation.
Participations without significant influence are valued at the historival cost. If a sustainable devaluation applies, valuation is at this lower value. Devaluation is charged to the income statement.
The liabilities from participations included under financial fixed assets are stated at the fair value of the provided amount, which is normally the nominal value, minus any provisions deemed necessary.
2.5.3 Shares and other variable income securities
Shares and convertible bonds are stated at fair value based on official listings in the financial markets. Value changes are accounted for directly in the income statement.
2.5.4 Bonds and other fixed-interest securities
Bonds are stated at fair value based on official listings in the financial markets.
2.5.5 Derivatives
DELA Group has forward exchange contracts and an option for extra shares in a participation; both are stated at fair value. In addition, DELA Group has a convertible loan. This involves a compound financial instrument which comprises a loan and an embedded derivative, namely the option to convert the loan into shares. This embedded derivative is separately stated at fair value. The profit and loss from the revaluation into fair value on the balance sheet date is immediately processed in the income statement. It involves all non-listed items which are valued based on financial models – the 'mark-to-model' method. Any derived financial instruments with a negative value are categorised on the balance sheet under short-term debts.
2.5.6 Mortgage loans
Receivables from mortgage loans are valued at the amortised cost price. The direct costs related to the provision of a mortgage loan are included as acquisition costs. They are part of the amortised cost price and are capitalised on the balance sheet. An assessment will be made on the balance sheet date as to whether there are objective observations for the impairment of the receivables resulting from mortgage loans. If this proves to be the case, the loss is accounted for in the income statement.
2.5.7 Other loans
The investments in company loans are stated at fair value. Other loans with a fixed interest are valued at amortised cost price minus a provision for doubtful debts.
2.5.8 Real estate funds, infrastructure funds, and agriculture and forestry funds
Participations in real estate funds, infrastructure funds and horticulture and forestry funds are stated at fair value. This item includes investments without frequent market quotation. Section 5.2 provides further clarification of the valuation method. Value changes are accounted for directly in the income statement. In addition, a revaluation reserve is established for the unrealised value increase.
2.5.9 Mortgage funds
Participations in mortgage funds are stated at fair value. This item includes investments without frequent market quotation. Section 5.2 provides further clarification of the valuation method. Value changes are accounted for directly in the income statement.
2.5.10 Investments in cash and cash equivalents
Investments in cash and cash equivalents are stated at fair value, which equals the nominal value.
2.5.11 Other financial investments
Other financial investments are stated at fair value. This item includes investments without a frequent market listing. Section 5.2 provides further clarification of the valuation method. Value changes are accounted for directly in the income statement. In addition, a revaluation reserve is established for any unrealised value increase. An exception is the art collection which is valued at cost price.
2.6 Receivables
Receivables are initially processed at fair value, then valued at the amortised cost price. Any provisions deemed necessary for possible losses due to doubtful debts are subtracted. These provisions are determined based on an individual assessment of the receivables.
Deferred tax assets are included for any temporary differences between the value of the assets and the liabilities in accordance with the tax regulations on the one hand and the valuation principles used in this financial statements on the other. The deferred tax assets are calculated based on the tax rates applicable at the end of the reporting year or the rates that will apply in the coming years, insofar as these have been legally established.
2.7 Other assets
2.7.1 Real estate in own use
Real estate in own use is valued at the historical cost, minus cumulative depreciations and, where applicable, impairments. The depreciations are based on the expected future term of use and calculated based on a fixed percentage of 3 percent of the historical cost, taking any residual value into account. Depreciation is applied from the moment the object is taken into use. Land is not subject to depreciation. Periodical large-scale maintenance is capitalised in accordance with the component approach, in which the total expenditure is attributed to the component parts.
2.7.2 Other intangible assets
The other intangible assets including inventories and vehicles are included at the historical cost minus depreciations based on the expected lifespan, taking any residual value into account. The costs of major maintenance are capitalised in accordance with the component approach and depreciated over the expected lifespan. Depreciation occurs linearly, under the following depreciation terms:
- Installations: 10 years;
- Inventory: 10 years;
- Hearses: 8 years;
- Other vehicles: 5 years;
- Company clothing: 2 years;
- Laptops: 4 years
2.7.3 Inventory
The inventory is valued at the historical cost in accordance with the FIFO (first in, first out) method or lower market value. The historical cost includes all costs associated with the acquisition as well as any costs incurred for storage in their current location and condition. The lower market value is the estimated sales price minus any directly attributable sales costs. The obsolescence of the inventory is taken into account when determining the lower market value.
2.8 Impairments of fixed assets
DELA Group assesses on the balance sheet date whether there are any indications that a fixed asset is subject to impairments. If so, the realisable value of the individual asset is determined. Should it not be possible to determine the realisable value for the individual asset, the realisable value of the cashflow generating unit of which the asset is part is determined. Estimates are used here. An impairment occurs when the book value of an asset is higher than the realisable value. The realisable value is whichever is highest between the market value and the value in use.
If it is determined that a previously accounted impairment no longer exists or has been reduced, the impairment is reversed to at most the book value that would have been determined if no impairment had been attributed to the asset.
With regard to financial instruments, DELA Group also assesses whether there are objective indications of impairments of a financial asset or group of financial assets. In the event of objective indications of impairments, the scope of the loss resulting from the impairment is determined and processed directly in the income statement.
For financial assets that were valued at the redemption value, the scope of the impairment is determined as the difference between the book value of the asset and the best possible estimate of the future cashflows, discounted at the effective interest rate of the financial asset as determined in the initial processing of the instrument. Any reversal of an impairment loss is limited to at most the amount that is required to value the asset at the amortised cost price. The reversed loss is then processed in the income statement. An impairment loss on goodwill is not reversed in the future.
2.9 Accrued receivables
Receivables are valued at nominal value minus any provisions deemed necessary for potential losses resulting from doubtful debts.
2.10 Cash and cash equivalents
Cash and cash equivalents involve cash and bank balances. Any current account debts to banks are included as short-term debts under debts to credit institutions. Cash and cash equivalents are valued at face value.
2.11 Minority interest
The minority interest in the group equity involves the third-party minority interest in the equity of the consolidated companies. The minority interest in the result of the consolidated companies is deducted from the group result in the income statement.
If the loss attributable to the minority interest exceeds the minority interest in the equity of the consolidated companies, the loss and any possible further losses shall be entirely borne by DELA Group unless and insofar as the minority shareholder has the obligation and is able to cover these losses. Should the consolidated companies start to make a profit again, this profit will be passed on to DELA Group until any loss covered by DELA Group has been fully repaid.
2.12 Provisions
2.12.1 General
Provisions are made for legal or constructive obligations that exist on the balance sheet date for which it is probable that an outflow of resources will be necessary and the scope of this outflow can be reliably estimated.
The provisions are valued as a best estimate of the amounts required to settle the obligations on the balance sheet date. The provisions are valued at present value of the expenses that are expected to be necessary to settle the obligations unless stated otherwise.
If it is expected that a third party will pay the obligations and it is likely that the payment will be received once the obligation has been settled, the payment is included in the balance sheet as an asset.
2.12.2 Pension provision
The Netherlands
The pension plan of the group companies in the Netherlands consists of an available premium scheme in which participants build up a capital with which they are expected to buy pension benefits at the time of their retirement.
The main features of this scheme are:
- the employer pays a monthly premium for each employee to the pension provider;
- the pensionable salary is 1.1666 times the fulltime monthly wage paid in the calendar month, with an annual maximum (2022: €114,886);
- the pension base over which the employer contributes a premium is the pensionable salary minus the franchise (2022: €14,802);
- the pension premium paid to the pension provider is based on an age table with incremental premium percentages. Personnel who were employed from 1 January 2022 are entitled to a pension premium of 22 percent of the pension base regardless of their age
- the employee contribution is 4.5 percent of the pension base. Personnel who were employed from 1 January 2022 pay a contribution of 6 percent of the pension base;
- the scheme does not result in any obligation on the balance sheet date, with the exception of obligations resulting from future premiums.
Participants are also insured for a partner pension with a scope of 1.16 percent of the pension base multiplied by the number of years of service from when they started participating in the pension scheme to the pensionable age. The orphan’s pension is 20 percent of the partner pension. Participants are subject to a premium exemption in the event of disability. In addition, there is an additional disability benefit insurance that pays out depending on the level of disability.
Pension schemes in the Netherlands are subject to the conditions of the Dutch Pension Act. DELA Group pays premiums to insurance companies on a compulsory, contractual or voluntary basis. The premiums are accounted for as personnel costs as soon as they are due. Advance premiums are included as accrued assets if they result in reimbursement or a reduction of future payments. Premiums that have yet to be paid are included in the balance sheet as an obligation.
Belgium
A defined contribution scheme applies in Belgium. Upon retirement, participants can choose to be paid the capital as a one-off amount or convert it into a periodic pension payment. The main characteristics of this pension scheme are:
- the employer pays a monthly premium to the pension provider;
- the premium is 4 percent of the reference salary, plus 4.4 percent tax;
- the reference salary is 13.92 times the gross monthly salary.
Employees are also provided with a life insurance policy in which the bereaved receives the insurance capital if the employee dies before the end date. In addition, the insured receives a replacement income in the event of disability due to illness, pregnancy or a personal accident.
Germany
In Germany the statutory pension premiums are paid via the monthly social insurance premiums. There is no additional company pension.
2.12.3 Provision for work anniversaries
The provision for work anniversaries is included as expected costs during the course of employment. The actuarial method applied to determine the provision is known as the Projected Unit Credit method, which takes into account future salary increases, survival and disability rates, and more. A percentage of 3.7 percent (2021: 1.2 percent) is applied to the long-term investment return and 2.0 percent (2021: 2.0 percent) for the general salary increase. The AG Generation Table 2020 and WIA/IVA data are also applied. The calculated obligation was then discounted by 3.7 percent at the end of 2022 (2021: 1.2 percent).
2.12.4 Deferred tax obligations
For any tax amounts to be paid in the future resulting from differences between commercial and fiscal balance sheet valuations, a provision is made equivalent to the sum of these differences multiplied by the applicable tax rate. This provision is then reduced by the still to be settled tax amounts resulting from tax loss carry-forwards insofar as it is likely that the future fiscal profits will be available for settlement. The provision for deferred tax obligations is stated at nominal value. The calculation of the deferred tax obligation applies the tax rates applicable at the end of the reporting year or the rates that will be applicable in coming years, insofar as these have been legally determined. The tax rate at the end of 2022 in the Netherlands was 15 percent over a profit of up to €395,000 and 25.8 percent for higher amounts. In Belgium the tax rate at the end of 2022 was 25 percent. In Germany, the applicable nominal value of 30 percent is taken into account. In 2023, the tax rate in the Netherlands will rise to 19 percent over a profit of €200,000 and 25.8 percent for higher amounts. No changes have been proposed for Belgium and Germany.
2.12.5 Restructuring provision
This provision is related to costs involving any restructuring of activities and is made in case a constructive or legal obligation arises for the Group. A provision is made if, on the balance sheet date, a plan has been formalised and there is either a legitimate expectation among those involved that the restructuring will take place or the implementation of the restructuring plan has already started. A provision will also be included in the balance sheet for reorganisations for which a plan has been formalised on the balance sheet date, but for which there is either a legitimate expectation among those involved that the restructuring will take place or the restructuring plan will be implemented after the balance sheet date.
2.12.6 Other provisions
If the effect of the time value of money is material, the other provisions will be valued at the present value of the expenses expected to be needed to settle the relevant obligations. Discounting is based on a discount rate for taxes that reflects both the actual market value and the specific risks related to the obligation. If the effect of the time value of money is not material, the other provisions are stated at nominal value. Unless otherwise stated, the other provisions are stated at present value.
2.13 Discretionary profit sharing
Profit sharing is calculated actuarially and has a provisional character. The profit share is determined by the general meeting on the recommendation of the Executive and Supervisory Boards. The processing of the discretionary profit share takes place via the technical provisions item. The addition of the amount the DELA Group has appropriated for discretionary profit distribution under the technical provisions is charged to the result.
2.14 Technical provision
2.14.1 General
Determining the technical provisions is a process that by its very nature involves uncertainties. The actual payments depend on factors such as social, economic and demographic trends, inflation, investment returns, the behaviour of policyholders, and assumptions about mortality developments. Any application of different assumptions for these factors than the tariff principles currently used in the financial statement could have a material effect on the technical provisions and underwriting costs (see also 5.10: Liability adequacy test).
2.14.2 Funeral insurance
For payments based on insurance policies that are expected to be made in the future, an obligation is included as soon as the policy is implemented. The obligations for funeral insurance at own expense and risk consists of the (with tariff interest) discounted value of the expected future payments (based on the mortality rate and including already appropriated profit distribution) to policyholders or other beneficiaries, minus future premiums.
The majority of the technical provisions for own-risk funeral insuranceas established in the Netherlands are calculated in accordance with the pure net method at an interest of 2.75 percent and based on the GBMV 1995-2000 mortality table as published by the Actuarieel Genootschap, using the principles related to mortality and interest. For insurance policies with a temporary premium payment, the actuarial interest for the period after the end date of the premium payment is 2 percent.
The technical provisions related to the Yarden portfolio acquired in 2021 are subject to principles that fall under a valuation at fair value at the time of acquisition. The actuarial interest is 1.3 percent on average and the mortality rate is based on the 2020 prognosis table of the Actuarial Society of the Netherlands. Lapses due to other causes than death were also taken at the moment of acquisition into account based on empirical data and the actual cost level. In addition, there are two additional provisions regarding the Yarden portfolio:
- DELA created a provision of €62.4 million to finance the future indexation of the Yarden package policies. These future indexations are estimated at the moment of acquisition and the fair value of this provision will be the present value of these withdrawals.
- DELA also guaranteed that bereaved will not have to pay inflation deficits for the first ten years after the acquisition. These deficits are estimated at the moment of acquisition and discounted resulting in the fair value of the commitment.
The majority of technical provisions for own risk funeral insurance as established in Belgium are calculated in accordance with the pure net method at the usual interest from the moment of implementation and based on the usual mortality table, using the principles related to mortality and interest. The expected payments are based on the principles of the rate as determined when the policy was signed.
The technical provision for funeral insurance as established in Germany is calculated in accordance with the pure net method at an interest of 2 percent. The mortality rate is based on tables produced by the German Actuarial Society.
The technical provisions in the insurance portfolio acquired in Germany in 2022 are subject to principles associated with a valuation at current value on the acquisition date. The actuarial interest is 2.5 percent on average, and the mortality rate is based on the prognosis for 2022 by the Actuarial Society of the Netherlands.
2.14.3 Life insurance
The technical provision for the DELA LeefdoorPlan (life insurance plan) is calculated in accordance with the pure net method at an interest of 3 percent and based on the tables published by the Actuarial Society of the Netherlands when the rate was introduced.
The technical provision for life insurance as established in Germany is calculated in accordance with the pure net method at an interest rate of 3 percent plus a provision for unearned premium. The mortality rate is based on mortality tables as produced by the German Actuarial Society.
2.14.4 Savings plan
The technical provision for the DELA CoöperatiespaarPlan (savings plan) is calculated in accordance with the built-up policy value based on the paid savings premiums, the already allocated profit shares and the interest rate linked to the rate.
2.14.5 Premiums
The premiums include surcharges for the coverage of the costs. When the premiums are received or become claimable, the surcharges are released and made available for the coverage of the actual costs, which includes ongoing costs and acquisition costs.
2.14.6 Acquisition costs
The deferred acquisition costs are deducted from the provision.
2.15 Long-term liabilities
Long-term liabilities have a term of more than one year and are initially processed at fair value, which is initially the same as the amortised cost price. Transaction costs that can be attributed directly to the acquisition of the liabilities are valued in the initial processing, after which long-term liabilities are valued at the amortised cost price. This consists of the amount received, taking into account agio or disagio minus the transaction costs. If no (dis)agio applies, this amount is the same as the nominal value.
The difference between the determined book value and the eventual payment value is processed as interest costs in the income statement based on the effective interest during the estimated term of the liabilities.
2.16 Short-term debts
Short-term debts are valued in the same way as long-term liabilities, although they have a term of one year or less.
2.17 Accrued liabilities
Accrued liabilities are stated at nominal value.
2.18 Leasing
DELA Group does not have any financial lease contracts. Lease contracts that do not qualify as a financial lease are listed as operational leases. For operational leases, the lease payments are processed linearly at the expense of the result over the course of the lease.
2.19 Revenue recognition
2.19.1 Premium income
The gross premiums consist of the premiums that are payable by policyholders for insurance contracts. The gross premiums excluding taxes and other fees resulting from insurance contracts are included as income when they are due by the policyholder. For single premium contracts the premium is included as income when it is due, with any cost and risk coverages being postponed and included in the result in a constant ratio to the ongoing insurance.
2.19.2 Reinsurance premiums
The reinsurance premiums include the premiums resulting from reinsurance contracts. They are stated as a cost in the income statement pro rata to the term of the contract.
2.19.3 Turnover funeral company
The income of the funeral company is included at the moment the services are delivered.
2.19.4 Other turnover
Other turnover accounts for the income resulting from other sources than the operational activities of DELA Group.
2.19.5 Net turnover
Net turnover is the income from the delivery of goods and services minus discounts and the like as well as the taxes imposed on the turnover, and after the elimination of transactions within DELA Group. One of these eliminations ensures payments by the insurer used to realise funerals at the funeral company.
2.20 Acquisition costs
Acquisition costs are costs directly related to the implementation of insurance policies, which depend on and relate to the acquisition of new insurance contracts or the extension of existing ones. The acquisition costs comprise provisions paid to third parties for insurance products. The acquisition costs are deducted from the technical provision, depreciated over ten years and charged against the result. The annual provisions are offset by the return provisions reclaimed throughout the year. Acquisition costs are deducted from the technical provision insofar as they can be reclaimed from the expected gross result of the underlying new production of that year. The depreciation period is assessed periodically. Where applicable, the depreciation cost is adapted to the shorter depreciation period, which currently stands at ten years.
As part of the liability adequacy test, impairments to the attributed acquisition costs are assessed annually and a determination made as to whether the future contribution from the insurance products is sufficient to cover the attributed costs.
2.21 Personnel expenses
Wages, salaries and social security costs are processed in the income result insofar as they are payable to employees and tax authorities.
2.22 Other income and expenses
These are items that result from the ordinary operational activities but which are kept out of the operational result due to their nature, scope or incidental character. The goal is to enhance the analysis and comparability of the operational result over the years.
2.23 Depreciation of intangible and fixed assets
Intangible fixed assets and other intangible assets are depreciated over the expected future useful life of the asset from the moment it is taken into use. Land is not depreciated.
Future depreciations are adapted accordingly if there is a change to the estimated economic useful life.
Book profit and loss from the incidental sale of tangible fixed assets is accounted for under exceptional income and expenses.
2.24 Taxes
Taxes over the result are calculated over the result before tax in the income statement, taking into account any tax loss carry-forwards (insofar as they are not included in the deferred tax receivables) and tax-exempt profit, and after adding non-deductible costs. Future changes to the tax rate are also taken into account.
3. Notes on the cashflow statement
The cashflow statement was drawn up in accordance with the indirect method.
The financial resources in the statement consist of cash and cash equivalents, with the exception of deposits with a term of over three months. Cashflows in foreign currencies have been converted at the exchange rates at the end of each month.
Revenues and expenses resulting from interest, received dividends & rent and profit tax are included under the cashflow from operational activities. The historical cost of an acquired group company is included under cashflow from investment activities, insofar as payment took place in cash. The financial resources present in the acquired group company are deducted from the historical cost.
4. Risk
4.1 Solvency position
The solvency position of DELA Group is determined based on the standard model under Solvency II.
4.1.1 Development of solvency position
In 2022 an adjustment was made to the models used to determine the solvency ratio to reflect an inaccuracy found during an internal check. The adjustment meant that the solvency ratio at the end of 2021 was 236 percent, not 266 percent. The ratios of the previous years have been adjusted in the key figures. After the discovery of this inaccuracy, we asked an independent third party to carry out a full model review. This showed no further inconsistencies related to the determination of the solvency ratio. The internal monitoring processes were enhanced.
The Solvency II ratio for 2022 is at virtually the same level as the previous year. Various developments such as the negative investment result and rising interest rates and inflation have opposite effects which almost cancel each other out. Stress tests show that the solvency position is robust, but that DELA Group is sensitive to scenarios with a low interest rate and low inflation.
4.1.1.1 Development of solvency capital requirement
The composition of the capital requirement is shown in the table below.
Composition SCR
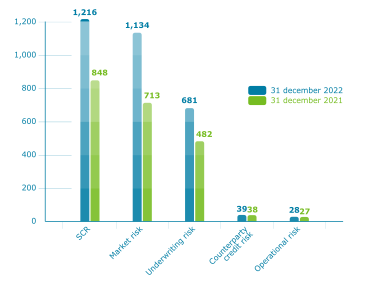
The model was adjusted after an inaccuracy was found. This involved an adjustment to the SCR on 31-12-2021 to €848 million. See section 4.1.1 for further details.
It is clear that the underwriting risks and market risks are the largest. The gross positions of both (without taking into account the mitigating effect of profit sharing) are approximately the same as they were at the end of 2021. The mitigating effect of the profit distribution was reduced. This is due to the significant increase in interest rates in 2022, and therefore the coverage. This was 234 percent at the end of 2022 which is higher than the level of 210 percent at which a full profit distribution is given. As a result, the Solvency-II fluctuations partially lead to less profit distribution and the mitigating effect of profit sharing is therefore lower than at the end of 2021.
4.1.2 Development of core capital
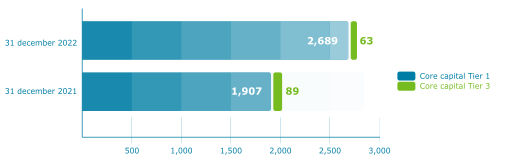
The model was adjusted after an inaccuracy was found. This involved an adjustment to the core capital on 31-12-2021 to €1,996 million. See section 4.1.1 for further details.
Both the capital requirement and the core capital increased in 2022. Due to the interest rate increases in 2022 the value of the technical provisions fell significantly, which meant that the core capital rose despite the negative investment return. The composition of the core capital is represented in the table below (amounts in € million).
Core capital composition
4.2 Risk profile
DELA Group is exposed to a wide range of risks. The figure below shows the main risk areas classified as low, medium and high.
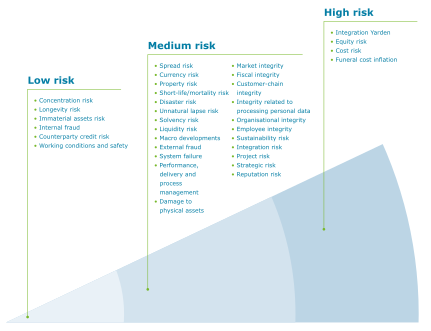
The risk classification indicates, among other things, the level of management focus on the relevant risk. The starting point is that risks in the ‘medium’ category are periodically included on the agenda of the responsible management team. This means that the ‘high’ category risks are actively monitored and discussed more frequently. Risks in the ‘low’ category are estimated to be so minimal that they are itemised less frequently. The risk classification takes into account all (risk-mitigating) measures as present in DELA Group.
The various risks and the related developments in 2022 are discussed below. To enhance readability not all risks are discussed in detail and some are combined.
4.2.1 Market risks
The market risk is the risk of possible losses due to unfavourable developments in the financial markets. The value of the investments and obligations depend on developments in these markets, the composition of the investment portfolio and the characteristics of the insurance obligations.
DELA Group has mitigated the market risk to a significant extent through its profit distribution scheme and premium measure, as well as via derivatives that mitigate part of the currency risk. DELA Group also applies the ‘prudent person’ principle to its investment policy, and full and/or partial ALM studies are performed periodically to assess whether the investment policy is still suitable.
The table below shows the development of the market risk, quantified based on the presented standard model (amounts in € million).
Market risk development
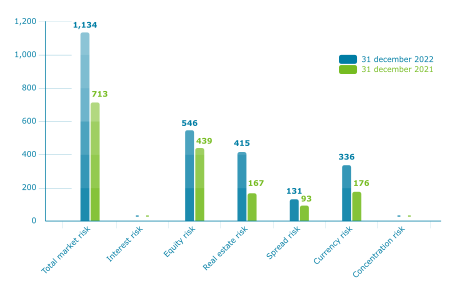
The financial markets were volatile in 2022 (as they were in 2021). Interest rates and inflation increased compared to 2021, and the investment return was negative. As the solvency can withstand these conditions, the higher risk estimate for the market risk was left unchanged.
The main developments impacting the capital requirement for market risks in 2022 were the aforementioned lower mitigating effect of the profit distribution and the adjustment of the investment mix. Compared to 2021, there were more investments in real assets (real estate, infrastructure, agriculture & forestry) and fewer in shares and bonds. This resulted in shifts in the capital requirements for market risks.
4.2.2 Underwriting risk
The underwriting risk is the risk that the scope and timing of pay-outs are not aligned to the expectations as included in the premium determination. DELA Group mitigates the underwriting risk in various ways, including via its profit distribution and premium measure, but also via reinsurance, (medical) acceptance and a continuous focus on costs.
DELA Group is exposed to the life insurance risk alone as it only provides life insurance policies. The portfolio largely consists of funeral insurance, with specific rates for the Netherlands, Belgium and Germany. These rates are based on specific characteristics and starting points (actuarial interest, costs, mortality tables) aligned to each country. Every year, DELA studies whether these starting points remain in line with the development of the relevant portfolios. The portfolio is large in numbers and scope, with a limited chance of fluctuations in the results. The portfolio of DELA Germany did increase significantly partly due to the fact that DELA Group acquired the funeral insurance portfolio of Monuta in 2022.
In addition, DELA Group has a temporary life insurance policy in the Netherlands and Germany. The insured capitals herein are significantly higher than in the funeral insurance. Reinsurance is used to limit any volatility of the results for this portfolio.
Finally, DELA Group has a savings product in the Netherlands. The mortality risk of this portfolio is limited at 10 percent of the built-up value.
The table below shows the build-up of the underwriting risk (amounts in € million).
Underwriting risk
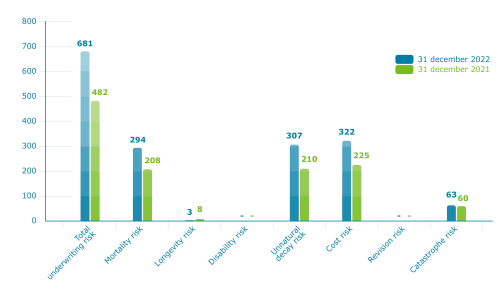
The underwriting risks increased. This was also due to the lower impact of the mitigating effect of the profit distribution due to the higher interest rates and coverage on 31 december 2022.
4.2.3 Credit risk
Credit risk (or: counterparty credit risk) is the risk of losses due to an unexpected default or unexpected worsening of the credit rating of the counterparties and debtors of the insurance company. This mainly involves receivables related to mortgages, reinsurers, derivatives or other debtor receivables. The scope of the credit risk in 2022 did not change significantly.
4.2.4 Liquidity risk
This is the risk that DELA Group is unable to fulfil its financial obligations to its policyholders or other creditors at any time because assets cannot be traded fast enough. The liquidity risk is not expressed as a capital requirement (SCR) in Solvency II. DELA Group must have sufficient cash and cash equivalents to pay claims resulting from the existing insurance agreements and to pay for its yearly expenses. DELA Group uses multiple banks in order to have access to a wide range of credit facilities. In addition, DELA Group has credit facilities with the custodian of the shares and bonds. DELA has fulfilled its financial obligations to policyholders and other creditors in 2022.
4.2.5 Operational risks
In addition to financial risks, DELA Group also faces operational risks. These are risks resulting from external influences related to the failing of people, processes or systems. The main operational risk areas are further detailed below.
Operational risks occur at all levels of the organisation. The control measures are therefore embedded in various specific policy documents, protocols and process descriptions.
This risk domain in DELA Group is built up of the following sub-risks:
4.2.5.1 Internal and external fraud
DELA Group distinguishes between internal fraud and external fraud. Internal fraud is that committed by DELA Group employees who undertake unauthorised activities to enrich themselves and by doing so harm DELA Group. Examples are malversations, unjustified indemnities, purposefully declaring incorrect working hours, etc. External fraud is committed by someone from outside of DELA Group (third parties, suppliers, customers, etc.) whose unauthorised activities impact DELA Group. DELA Group does not accept any type of internal or external fraud in its risk appetite. The presence of various control measures as defined in policy documents (e.g., fraud policy) and process descriptions means that internal fraud risks are considered low and external fraud risks medium for DELA Group.
4.2.5.2 Working conditions and safety
The risks included here involve losses due to actions which are out of step with legislation in the field of working conditions, health or safety, or as a result of events related to inequality or discrimination. DELA Group does not accept higher risks with regard to the health and safety of its employees in its risk appetite. The presence of various control measures as defined in policy documents (e.g., the health and safety policy) and protocols means these risks are considered low for DELA Group.
4.2.5.3 Physical assets
This involves risks of loss of or damage to the head office, funeral centres and crematoriums due to natural disasters or other events. DELA Group does not accept risks related to the availability of its funeral facilities. The presence of various control measures as defined in policy documents and procedures means these risks are considered medium.
4.2.5.4 System failure and process managementt
This involves the risk of disruptions of operations due to system failure, and includes themes such as cyber threats and information security. The risk of losses due to failing transaction processing or process management or relationships with suppliers are also included. DELA Group has formulated a number of statements in its risk appetite:
- DELA Group does not accept risks related to disruptions of IT/telecom systems that lead to a substantial disruption of business-critical operational processes;
- DELA Group does not accept risks that fundamentally affect DELA’s reputation;
- DELA Group does not accept risks related to controlled business operations.
The presence of various control measures as defined in policy documents (such as an information security protocol and process management policy), process descriptions and protocols means the risks related to process management and system failure are considered medium.
Development of operational risks in 2022
While the initiatives started within DELA Group have led to improvements in 2022, activities related to the integration of Yarden and DELA led to less progress in some segments than originally planned. Despite the completed integration, this risk domain requires a focus on Yarden locations. DELA Group estimates the risks in the field of process management and system failures as well as physical assets to be medium. These estimates remained unchanged in 2022 compared to 2021. Various developments were started in 2022 which are leading and will continue to lead to an improvement of internal control. All things considered, this should result in a consistent risk estimate. Flaws were found in the cloud environment in Belgium during 2022. Management responded immediately and prevented any incidents occurring.
4.2.6 Integrity risks
Integrity risks are paired with the threat of damage to DELA’s reputation or existing or future threats to the capital or results as a result of insufficient compliance with the law. In principle, DELA Group monitors this issue from its compliance function based on the themes in the systematic integrity risk analysis (SIRA). The remaining risk is therefore considered very limited, and DELA believes that no additional capital has to be reserved.
The SIRA themes are:
- Organisational and employee integrity: organisational integrity includes themes such as governance and outsourcing. Employee integrity involves the integrity of the Executive Board, the internal supervising body, and internal and external employees. Related subjects are pre- employment screening, professionalism and conflicts of interest.
- Customer-chain integrity: this involves both the integrity of customers and how the organisation treats customers. It also includes the integrity of the chain in which the company operates. Themes range from duty of care to combatting money laundering and terrorism.
- Market integrity: this relates to the integrity of the (financial) market(s), including issues such as competition and market abuse.
- Integrity related to the processing of personal data: this involves the integrity of the data used within DELA Group(such as the processing and security of personal data).
Development of integrity risks in 2022
A major development that affected all integrity risks in 2022 was the integration of Yarden. In addition, the allocation of a fulltime Data Protection Officer enhanced the focus on the correct and timely processing of personal data. A DNB study into compliance with the Sanctions Act and regulations enhanced the focus on customer-chain integrity in 2022. The findings from this study helped improve compliance. Another major development is visible in Procurement, and, more specifically, in the outsourcing theme as part of SIRA Organisational Integrity. In 2022 the procurement and outsourcing policy was updated and the focus on outsourcing enhanced. Further steps are required in 2023 to adapt the current contracts to the new requirements and gain a better insight into the outsourcing chains.
Fiscal integrity was added as a separate domain within SIRA in 2022 and relates to the fiscal control within DELA Group. Second line managers will further develop the monitoring of key fiscal risks in 2023 in alignment with the tax manager and responsible management.
4.2.7 Other risks not part of the standard model
In addition to the risks included in the standard model related to determination of the capital requirements, there are various other risks that are of interest to DELA Group. The sections below describe these risks in further detail.
4.2.7.1 Strategic risks
This involves uncertainties that may impede implementation of the long-term strategy. These risks may hinder expansion abroad or restrict the ability to keep to the business model and its essential profit distribution concept. These risks can largely be minimised via a proper strategy process, supervised by external consultants, and monitored by the Supervisory Board. The implementation involves business cases to assess the required investments and keep them manageable. In addition, the annual Own Risk and Solvency Assessment checks which risks are a potential threat to the continuity of the DELA Group. Stress tests show that the solvency position is robust, although DELA Group is sensitive to scenarios with low interest rates and low inflation. Preparatory measures are taken or different choices made where necessary. The main preconditions and measures are developed in the capital policy, which is evaluated annually. The risks are therefore considered limited and no additional capital has to be set aside.
External developments that may impact the strategy are constantly monitored and included in the ongoing strategy process.
4.2.7.2 Reputation risk
The reputation risk is the threat of any damage caused by a loss of reputation. It is controlled by the active development of reputation management, with incident management being a major spearhead. This involves the timely identification of possible reputation risks and any associated spill-over effects, and taking timely management actions where necessary. The company culture and desired tone at the top are other important factors in mitigating this risk. They are supported by training programmes, the administrative organisation and internal controls. The risk is therefore considered limited and no reason to reserve additional capital.
4.2.7.3 Funeral cost inflation
The standard model does not include a funeral cost inflation risk. Although inflation is primarily a risk for policyholders, it is relevant to DELA as an increase in funeral costs directly results in a premium increase. DELA Group aims for a good service provision to members at the lowest premium possible. This is, in fact, a focal point in the ORSA. DELA Group has some influence on the development of funeral cost inflation and monitors this throughout the year.
4.2.7.4 Sustainability risk
The sustainability risk includes the risk of climate change. DELA Group is confronted with this both directly and indirectly via its investments. In 2022 the climate risk impact was re-analysed in the ORSA. The risks related to climate change have a limited impact on the coverage, premium increase and solvency. In pricing climate-related risks we see that coverage stays low for longer and the premium increase is higher than in the basic scenario. The solvency remains stable in the various climate scenarios.
4.2.7.5 Financial reporting risk
DELA Group also faces a financial reporting risk – i.e. that the financial and non-financial reports of the company contain substantially incorrect or incomplete information. It also involves the risk that internal and external stakeholders were not made aware of the reports in time. In DELA Group, this risk is limited via measures and procedures embedded in various policy documents and then implemented. Examples include the external reporting policy in accordance with the Reporting Guidelines (RJ), the Disclosure Policy (SFCR), and reports for the regulator.
5. Notes on the balance sheet
5.1 Intangible assets
Developments
| Amounts x €1,000 | 2022 | 2021 | |||
|---|---|---|---|---|---|
| Book value on 1 January | 140,940 | 85,916 | |||
| Investments | 17,572 | 23,301 | |||
| Disposals | - | -5,344 | |||
| Revaluations | -16,377 | -14,728 | |||
| Acquisitions | 6,123 | 58,346 | |||
| Depreciations | -13,348 | -6,551 | |||
| Book value on 31 December | 134,910 | 140,940 |
Intangible fixed assets, cumulative
| Amounts x €1,000 | 31-12-2022 | 31-12-2021 | |||
|---|---|---|---|---|---|
| Acquisition costs | 355,730 | 332,035 | |||
| Cumulative value revaluations and depreciations | -220,820 | -191,095 | |||
| Book value on 31 December | 134,910 | 140,940 |
Intangible fixed assets, specification
| Amounts x €1,000 | Goodwill | Acquired insurance portfolios | Software systems | Other | Total |
|---|---|---|---|---|---|
| Book value on 31-12-2021 | 92,276 | 10,221 | 33,808 | 4,635 | 140,940 |
| Investments | - | - | 17,572 | - | 17,572 |
| Disposals | - | - | - | - | - |
| Revaluations | -16,377 | - | - | - | -16,377 |
| Depreciations | -7,477 | -610 | -4,654 | -607 | -13,348 |
| Acquisitions | 6,123 | - | - | - | 6,123 |
| Book value on 31-12-2022 | 74,545 | 9,611 | 46,726 | 4,028 | 134,910 |
The investments in book year 2022 involve investments in multiple software systems. The acquisitions in 2022 involved acquisition of Belgian funeral activities.
In 2022 there was an impairment to the goodwill position of funeral activities acquired in the Netherlands and Belgium. This resulted in a devaluation of €16.4 million caused by an increase in the required returns (mainly due to the rising market rate) which meant that the expected return was no longer sufficient.
At the end of the year, a sum of €16.0 million of the goodwill position is reserved to acquired Dutch and Belgian funeral activities. The valuation of this goodwill position at the end of the year strongly depends on the expected return on the one hand and the expected future operating results on the other. Any major deviation from the current estimates could potentially have a significant effect on the book value.
5.2 Investments
DELA Group manages risk positions using the periodical Asset & Liability Management (ALM) studies as it aims to realise long-term investment results that exceed the interest obligations resulting from insurance contracts and deposits and help meet profit sharing ambitions. The main investment goal in the insurance company is the maximisation of the investment return within the authorised risk framework.
5.2.1 Real estate
Developments
| Amounts x €1,000 | 2022 | 2021 | |||
|---|---|---|---|---|---|
| Book value on 1 January | 672,637 | 642,785 | |||
| Investments | 22,137 | 18,764 | |||
| Revaluations | -43,216 | -31,399 | |||
| Disposals | -129,669 | -102,345 | |||
| Procurement due to acquisitions | - | 144,832 | |||
| Book value on 31 December | 521,889 | 672,637 | |||
| Acquisition costs | 338,142 | 445,674 | |||
| Cumulative value changes | 183,747 | 226,963 | |||
| Book value on 31 December | 521,889 | 672,637 |
Real estate involves investments in direct properties. The balance sheet of DELA Group does not include any real estate investments from operational leasing in which DELA Group is the lessee. To realise a better geographical distribution of real estate investments, parts of the portfolio were sold from 2020 onwards and investments made in international real estate funds (investment category: real estate funds). The value of the properties (excl. crematoriums) which were still in the portfolio at the end of 2022 had fallen by approximately 4 percent during the year. The market rent of these assets fell by around 4.3 percent. At the end of 2022 the total value of this portfolio was 14.4 times the market rent (2021: 14.3 times).
A positive result of €7,772 was realised over the disposals. The sales result is determined by the difference between the net sales return and the valuation on the balance sheet on the selling date.
Other real estate does not include assets that are not being used for company activities.
The overview below shows a categorisation of the real estate objects.
Real estate, specification
| Amounts x €1,000 | 31-12-2022 | 31-12-2021 | |||
|---|---|---|---|---|---|
| Retail (-/- environmental provision) | 152,096 | 260,172 | |||
| Residential | 6,085 | 18,298 | |||
| Crematoriums | 299,234 | 328,607 | |||
| Offices | 35,051 | 35,890 | |||
| Parking | 3,410 | 3,570 | |||
| Other | 26,013 | 26,100 | |||
| Total | 521,889 | 672,637 |
The investments in retail mainly consist of retail properties at A-1 locations and shopping centres throughout the Netherlands.
Other real estate relates to DomusDELA. The fair value of DomusDELA Vastgoed and Klooster for the first five years is based on the establishment costs as this period is considered a start-up phase.
Of all real estate, €8,510 involved crematoriums that were under development on 31-12 2022. The valuation of real estate under development did not take into account.the company’s development costs, other indirect costs or interest rates.
Real estate, amounts in income statement
| Amounts x €1,000 | 2022 | 2021 | |||
|---|---|---|---|---|---|
| Rental income | 44,972 | 46,743 | |||
| Other income and costs | -37,898 | -41,392 | |||
| Operating costs | -13,922 | -10,309 | |||
| Total | -6,848 | -4,958 |
The rental contracts of commercial real estate are drawn up based on ROZ model 2012. 93 percent of the contracts have a fixed term and are extended automatically if not terminated. 59 percent have a fixed term with an extension rule of five years, and others have various fixed terms (usually one or three years). About 7 percent of the contracts are indefinite and can be terminated at any time with a term of notice of one year. The rental contracts do not include an option to buy.
The negative ‘Other income and costs’ are mainly the result of an unrealised depreciation in value in the real estate; this is part of the investment results.
DELA Group has a limited exposure to operating costs related to vacant properties.
Contractual obligations on balance sheet date
| Amounts x €1,000 | 31-12-2022 | 31-12-2021 | |||
|---|---|---|---|---|---|
| For new builds | 2,210 | - | |||
| For redevelopment | - | - | |||
| Total | 2,210 | - |
The valuations of real estate include estimates, which means there is a level of uncertainty in the value and a bandwidth should always be taken into account. The accuracy of an appraisal of a common object should be within a bandwidth of 10 percent (+ / -) of the value. The valuation method used for each real estate category is clarified below.
Valuation method for retail, residential, offices and parking
The valuation of real estate is partly based on available market data and is calculated by external appraisers. The appraisals are made in accordance with RICS appraisal standards and the regulations of the Register of Real Estate Appraisers in the Netherlands (NRVT). Both the RICS standards and the NRVT regulations – and therefore the appraisals – comply with the International Valuation Standards. Depending on the type of real estate, the BAR/NAR method, direct capitalisation method and discounted cashflow (DCF) methods are used. At least once every three years the value is determined by independent, external experts by means of a full valuation based on the private sale value in rented state. In the other years, the value is based on a reappraisal that is also made by external experts. The entire portfolio is valued by external appraiser CBRE. The company has an ISAE3402 type II attestation and the responsible appraisers are registered with NRVT. The applied discount rate is between 2 percent and 7 percent, depending on the applied risk premium determined per complex. The gross initial return is between 3.6 percent and 13 percent. In the event of a definitive and unconditional agreement to sell a real estate object, this is valued at the agreed selling price.
Retail
The direct capitalisation method or the DCF method are applied to calculate the fair value of the retail objects. The appraiser considers which method is best suited to determine the value of each object. The direct capitalisation method is mainly used for shops, the DCF method more commonly used for shopping centres. The direct capitalisation method determines the fair value based on the gross market rent value of the lettable floor surfaces of the buildings and/or premises, minus the operating costs and other expenses linked to the object, and related to a net return that is considered realistic in current market conditions.
Residential
The DCF method is used to determine the fair value of residential objects. This calculation assumes a return over a review period of ten years. The cashflows consist of rental income minus the operating costs and other expenses linked to the object.
Parking and offices
It is standard in the market to value parking facilities (garages and car parks) and offices based on the income approach and the comparative method. The valuation is therefore based on a combined BAR/NAR-DCF calculation.
Valuation method for crematoriums
Crematoriums are stated at fair value on the balance sheet date. Both the DCF method and direct capitalisation are used to determine this fair value for crematoriums older than five years. The applied discount rates are in line with the market and lie between 9.3 percent and 10.3 percent. In addition, the value is assessed by independent external experts once every five years. In the intervening years, the current value is determined internally. The external valuation takes place on a rotational basis over the portfolio, which means that part of the portfolio is always determined annually by independent, external experts.
Crematoriums less than five years old are valued based on the establishment costs, as this is considered a start-up phase. In addition, an internal calculation method is used every year to see whether any impairments should take place.
Due to the lack of actual transactions in the market that could be used to validate the appraisal process, the appraisal of real estate comes with a significantly increased level of uncertainty. In the event of sales transactions in the period in which the financial statements is being drawn up and when there are deviations between the selling price and appraisal value, valuation of a real estate object is based on the realised selling price. Sales results and value changes of real estate stated at market value are processed in the income statement. In this statement, these value changes – insofar as they are cumulatively positive (at the building level) – are processed in the revaluation reserve in which deferred taxes are taken into account. The original cost price, where no correction for depreciation is made, is also taken into account.
5.2.2 Participations
Specification
| Amounts x €1,000 | Share in issued capital | 31-12-2022 | 31-12-2021 | ||
|---|---|---|---|---|---|
| - Société d'Étude et de Service pour la Crémation N.V., Rue des Nutons 329, Charleroi | 35% | 1,242 | 594 | ||
| - Stoppelenburg B.V., Populierenlaan 122a, Krimpen aan den IJssel | 20% | 712 | 658 | ||
| - Neo Joule B.V., Sintelstraat 27, Maasbracht | 18% | 1,400 | 1,400 | ||
| - The Right Meal B.V., Melkpad 49, Hilversum | 16% | 275 | 275 | ||
| - Salarise B.V., Hoofdstraat 244, Driebergen-Rijsenburg | 25% | 657 | 910 | ||
| - Jelsumerhof Beheer B.V., Sem Dresdenstraat 2A, Leeuwarden | 25% | 178 | 162 | ||
| Total | 4,464 | 3,999 |
Participations, developments
| Amounts x €1,000 | 2022 | 2021 | |||
|---|---|---|---|---|---|
| Book value on 1 January | 3,999 | 2,038 | |||
| Procurement due to acquisitions | - | 155 | |||
| Investments | - | 1,793 | |||
| Result participation | 515 | 13 | |||
| Dividend payments | -50 | - | |||
| Book value on 31 December | 4,464 | 3,999 |
- DELA Funerals Assistance 1 BVBA has a 35% interest in Société d'Étude et de Service pour la Crémation NV;
- DELA Uitvaartverzorging NV has a 20% interest in Stoppelenburg BV, a funeral company located;
- DELA Holding NV has a 18.4% interest in Neo Joule BV which was set up to research various cremation methods;
- Voor Elkaar Holding N.V. has a 16.2% interest in The Right Meal BV. The company offers personal dietary advice and supervision in the event of illness and treatment based on personal tastes and living conditions;
- Voor Elkaar Holding N.V. has a 25% interest in Salarise BV. This Peer-to-Peer loan platform provides attractive, repayable loans for people with employee salaries. DELA Holding NV has the option to expand its interest to 100%;
- DELA Uitvaartverzorging NV has an interest of 25% in the funeral company Jelsumerhof Beheer BV.
5.2.3 Other financial investments
Developments
| Amounts x €1,000 | Book value 31-12-2021 | Acquisitions | Sales and payments | Revaluation and other mutations | Book value 31-12-2022 |
|---|---|---|---|---|---|
| Shares and other variable income securities | 2,968,913 | 980,831 | -1,723,936 | -433,691 | 1,792,117 |
| Bonds and other fixed interest securities | 2,695,781 | 1,513,140 | -1,515,539 | -467,112 | 2,226,270 |
| Derivatives | - | - | - | 64,574 | 64,574 |
| Mortgage loans | 192,457 | 1,997 | -30,358 | -217 | 163,879 |
| Other loans | 359,668 | 66,201 | -121,219 | -61,372 | 243,278 |
| Real estate funds | 1,345,465 | 516,402 | - | 29,191 | 1,891,058 |
| Infrastructure funds | 554,968 | 397,641 | - | 50,048 | 1,002,657 |
| Agricultural and forestry funds | - | 104,346 | -660 | 103,686 | |
| Mortgage funds | 209,616 | 147,673 | - | -58,310 | 298,979 |
| Investments in cash and cash equivalents | 64,057 | - | - | 8,610 | 72,667 |
| Other financial investments | 12,644 | 288 | - | -2,038 | 10,894 |
| Total | 8,403,569 | 3,728,519 | -3,391,052 | -870,977 | 7,870,059 |
Other financial investments, other valuations
| Amounts x €1,000 | Balance value | Cost price | Market value | ||
|---|---|---|---|---|---|
| Shares and other variable income securities | 1,792,117 | 1,676,001 | 1,792,117 | ||
| Bonds and other fixed interest securities | 2,226,270 | 2,512,815 | 2,226,270 | ||
| Derivatives | 64,574 | - | 64,574 | ||
| Mortgage loans | 163,879 | 357,847 | 157,351 | ||
| Other loans | 243,278 | 260,165 | 243,278 | ||
| Real estate funds | 1,891,058 | 1,609,322 | 1,891,058 | ||
| Infrastructure funds | 1,002,657 | 900,195 | 1,002,657 | ||
| Agricultural and forestry funds | 103,686 | 104,346 | 103,686 | ||
| Mortgage funds | 298,979 | 354,389 | 298,979 | ||
| Investments in cash and cash equivalents | 72,667 | 72,667 | 72,667 | ||
| Other financial investments | 10,894 | 10,894 | 10,894 | ||
| Total | 7,870,059 | 7,858,641 | 7,863,531 |
Shares and bonds
All shares and bonds are listed on the stock exchange.
The modified duration formula is used to measure interest rate sensitivity. The average modified duration of the bonds and other loans is 6.1.
Shares, geographically distributed
| Amounts x €1,000 | 31-12-2022 | 31-12-2021 | |||
|---|---|---|---|---|---|
| Asia-Pacific | 33.4% | 35.1% | |||
| Europe | 25.9% | 29.7% | |||
| North America | 34.4% | 32.4% | |||
| Latin America | 3.7% | 1.6% | |||
| Middle East | 2.7% | 1.2% | |||
| Total | 100.0% | 100.0% |
Shares, categorised by sector
| Amounts x €1,000 | 31-12-2022 | 31-12-2021 | |||
|---|---|---|---|---|---|
| Financial institutions | 17.7% | 18.2% | |||
| Information technology | 15.9% | 16.9% | |||
| Luxury consumer goods | 11.9% | 13.0% | |||
| Industry | 11.2% | 10.8% | |||
| Health care | 10.3% | 9.8% | |||
| Consumer goods | 8.6% | 7.7% | |||
| Communication services | 6.5% | 7.2% | |||
| Raw materials | 6.2% | 6.4% | |||
| Energy | 5.7% | 3.9% | |||
| Real estate | 3.0% | 3.6% | |||
| Utilities | 3.0% | 2.5% | |||
| Total | 100.0% | 100.0% |
Fixed-interest securities, categorised by rating
| Amounts x €1,000 | 31-12-2022 | 31-12-2021 | |||
|---|---|---|---|---|---|
| AAA | 27.5% | 13.9% | |||
| AA | 13.2% | 7.3% | |||
| A | 6.5% | 7.2% | |||
| BBB | 17.6% | 17.0% | |||
| < BBB | 25.0% | 23.2% | |||
| Other | 10.3% | 31.4% | |||
| Total | 100.0% | 100.0% |
Unhedged foreign exchange positions
| Amounts x €1,000 | 31-12-2022 | 31-12-2021 | |||
|---|---|---|---|---|---|
| Hong Kong dollar | 145,840 | 189,493 | |||
| American dollar | 142,483 | 343,411 | |||
| South Korean won | 76,778 | 106,871 | |||
| Brazilian real | 65,481 | 58,632 | |||
| New Taiwan dollar | 64,138 | 108,403 | |||
| Indian rupee | 56,616 | 65,641 | |||
| Australian dollar | 54,760 | 46,057 | |||
| South African rand | 51,704 | 46,133 | |||
| Mexican pesos | 51,645 | 44,386 | |||
| Chinese yuan | 32,852 | 46,566 | |||
| Swiss franc | 32,012 | 69,690 | |||
| Indonesian rupiah | 31,172 | 38,560 | |||
| Canadian dollar | 30,455 | 48,485 | |||
| Thai baht | 29,125 | 21,717 | |||
| Malaysian ringgit | 25,007 | 17,678 | |||
| Other | 196,603 | 399,205 | |||
| Total | 1,086,671 | 1,650,928 |
Derivatives
The valuation of the derivatives (forward exchange contracts) is made based on the ‘mark-to-model’ approach. The average remaining term of these contracts is 2 months. There were also derivatives (forward exchange contracts) in place on 31 December 2021 but their value was negative so they were categorised on the liabilities side under short-term debts.
Mortgage loans
The mortgage loans involve direct investments in mortgages, all provided with NHG accreditation. The current value of the mortgage loans is €157,351. The current value of the collateral for the mortgage loans at the end of 2022 was €375,103.
Other loans
Some €3.5 million of the loans were at a fixed-interest percentage on 31 December 2022. For these loan is a security consists of a pledge on all outstanding shares in the relevant counterparty and a security deposit of €0.5 million.
Real estate funds
The real estate funds are not listed on the stock exchange. The valuation of the real estate funds involves the fair value using the DCF method. This valuation is taken from the fund managers and is the valuation model also used in the trading of property. The valuation is in accordance with generally accepted methods and set by an external appraiser/valuer. We receive an ISAE3402 Type II report or equivalent for most funds. The audit statement from the external accountant with the valuation or annual statement of the funds is only received in some cases after the DELA Group financial statements has been drawn up. Analysis has shown that sufficient certainty exists for the reliability of the valuations as accounted for by fund managers, although there is a limited risk of the kind of estimation uncertainty that can naturally occur for investments held by the fund.
Infrastructure funds and agricultural and forestry funds
The infrastructure funds and agricultural and forestry funds are not listed on the stock exchange. Their valuation is based on the fair value provided by fund managers. The valuations are established using the DCF method and local accounting standards, and we have determined that there are only marginal differences between them. The valuation is preferably performed by an external appraiser/valuer. We receive an ISAE3402 Type II report or equivalent for most funds. The audit statement from the external accountant with the valuation or annual statement of the funds is only received in some cases after the DELA Group financial statements has been drawn up. Analysis has shown that sufficient certainty exists for the reliability of the valuations as accounted for by fund managers, although there is a limited risk of the kind of estimation uncertainty that can naturally occur for investments held by the fund.
Mortgage funds
The mortgage fund is not listed on the stock exchange and comprises investments in non-NHG accredited mortgages. The valuation of these funds involves the fair value, and is taken from the fund managers. The valuations are established via the DCF method. Local accounting standards are applied and these are assessed by DELA for applicability within our valuation principles. The valuation is performed and reviewed internally by the fund’s external accountant and we receive an ISAE3402 Type II report. The audit statement from the external accountant with the annual statement of the fund is only received after the DELA Group financial statements has been drawn up. Analysis has shown that sufficient certainty exists for the reliability of the valuations as accounted for by fund managers, although there is a limited risk of the kind of estimation uncertainty that can naturally occur for investments held by the fund.
On the balance sheet date, the loan-to-value is 66,7 percent (2021: 71.3 percent)
Investments in cash and cash equivalents
Investments in cash and cash equivalents relate to receivables and debts directly linked to the investment portfolios with a mandate issued to the asset manager. It mainly involves cash positions in the various FGRs (joint account investment funds).
Other financial investments
The amounts included under the Other financial investment item relate to the art collection and interests in non-listed private equity firms. The market value of these private equity firms is based on the DCF method. The art collection is valued at cost price or lower market value; at the end of 2022 it amounted to €2.8 million (2021: €3.5 million).
Securities lending
DELA Group lends shares and bonds. To limit the risk for DELA Group, borrowers must provide collateral for the loans. Cash collaterals are not allowed and the lending parties must comply with strict requirements. To further limit the risk, the following additional restrictions are applied:
- counterparties must have a S&P rating of at least A-;
- collateral may only involve government bonds from OECD countries with a S&P rating of at least AA- in accordance with S&P;
- the market value of the collateral should be at least 102 percent of the market value of the loaned securities;
- shares on our engagement list are not eligible for lending. Engagement is the process by which active rights as shareholder are being used.
The market value of the loaned items on 31-12-2022 was €518.6 million (2021: €364.1 million). The value of the collateral is €536.2 million (2021: €376.2 million).
5.3 Receivables
Specification
| Amounts x €1,000 | 31-12-2022 | 31-12-2021 | |||
|---|---|---|---|---|---|
| Deferred tax assets | 90,733 | - | |||
| Corporate tax | 40,757 | 43,255 | |||
| Taxes and social insurance premiums | 11,185 | 13,361 | |||
| Loans to the Board | 107 | 250 | |||
| Debtors | 17,541 | 20,640 | |||
| Receivables from insurance | -251 | 2,580 | |||
| Other receivables | 31,195 | 7,125 | |||
| Total | 191,267 | 87,211 |
The other receivables have a term of less than one year, except for the deferred tax assets and the loans to the Board.
The other receivables increased because DELA was still expecting €11.9 million from the sale of a number of crematoriums at the end of 2022, which is being paid in instalments. The amount of this receivable may change later as the future results of the sold crematoriums will determine the definitive sales price.
The deferred tax positions are subjected to offsetting (where possible). The table below shows a specification of the various deferred positions that are presented jointly on the asset side of the balance sheet, which also include negative amounts due to the offsetting applied.
Deferred tax receivables, specification
| Amounts x €1,000 | 31-12-2022 | 31-12-2021 | |||
|---|---|---|---|---|---|
| - Related to different tax valuations of: | |||||
| - technical provision | 109,308 | - | |||
| - initial expenses | 38,222 | - | |||
| - securities | 55,309 | - | |||
| - real estate | -109,741 | - | |||
| - other | -2,365 | - | |||
| Total | 90,733 | - |
As a result of negative developments in the fair value of the investments in book year 2022, there was an increase in the deferred tax assets on investments.
€5,027 of the total deferred tax receivables are expected to be settled within one year.
Loans to the Board
The mortgage loan to a Board member, as referred to in Article 2:383 section 2 DCC, is €107 (2021: €250). Of this loan, €107 (2021: €250) has been provided at 3 percent and must be repaid by the Board member involved in the year they step down from their position. Repayments were made in the book year.
5.4 Other assets
Real estate in own use, developments
| Amounts x €1,000 | 2022 | 2021 | |||
|---|---|---|---|---|---|
| Book value on 1 January | 99,580 | 68,808 | |||
| Investments | 3,752 | 7,506 | |||
| Revaluations | - | -119 | |||
| Procurement due to acquisitions | 45 | 28,894 | |||
| Disposals | -2,457 | -594 | |||
| Depreciations | -4,804 | -4,997 | |||
| Other changes | - | 82 | |||
| Book value on 31 December | 96,116 | 99,580 | |||
| Acquisition value | 207,570 | 207,525 | |||
| Cumulative depreciations | -111,454 | -107,945 | |||
| Book value on 31 December | 96,116 | 99,580 |
The disposals resulted in a book loss of €22 (2021: book loss €101).
Other intangible assets, developments
| Amounts x €1,000 | 2022 | 2021 | |||
|---|---|---|---|---|---|
| Book value on 1 January | 26,198 | 26,932 | |||
| Investments | 7,621 | 4,246 | |||
| Procurement due to acquisitions | 134 | 2,314 | |||
| Disposals | -1,080 | -949 | |||
| Depreciations | -6,848 | -6,345 | |||
| Book value on 31 December | 26,025 | 26,198 | |||
| Acquisition value | 155,344 | 156,777 | |||
| Cumulative depreciations | -129,319 | -130,579 | |||
| Book value on 31 December | 26,025 | 26,198 |
The disposals resulted in a book loss of €330 (2021: book loss €3).
5.5 Group equity
Developments
| Amounts x €1,000 | 2022 | 2021 | |||
|---|---|---|---|---|---|
| Book value on 1 January | 1,778,413 | 1,343,251 | |||
| Result after taxes | -741,101 | 434,881 | |||
| Other changes in value | 270 | 281 | |||
| Book value on 31 December | 1,037,582 | 1,778,413 |
The total result over the book year amounted to minus €740,831.
5.6 Minority share
Developments
| Amounts x €1,000 | 2022 | 2021 | |||
|---|---|---|---|---|---|
| Book value on 1 January | 3,229 | 3,211 | |||
| Result after taxes | -177 | -195 | |||
| Other changes in value | 112 | 213 | |||
| Book value on 31 December | 3,164 | 3,229 |
5.7 Solvency
DELA Group determines the solvency based on Solvency II, which are European calculation rules that take into account the risks included in the balance sheet of the insurer. DELA Group applies the so-called Solvency II standard model for its calculations. This uses the interest rate term structure (including Ultimate Forward Rate) at the end of 2022 as determined by European supervisor EIOPA. The internal minimum solvency percentage deemed necessary has been set internally at 150 percent.
Solvency (based on Solvency II guidelines)
| Amounts x €1,000 | 31-12-2022 | 31-12-2021 | |||
|---|---|---|---|---|---|
| Required solvency | 1,216,049 | 847,537 | |||
| Available solvency | 2,751,276 | 1,996,018 | |||
| Solvency ratio | 226% | 236% |
An adjustment was made to the model used to determine the solvency after an inaccuracy was found. The Solvency II ratio on 31-12-2021 was adjusted to 236 percent for reasons explained in section 4.1.1.
The Solvency II ratio for 2022 is at virtually the same level as the previous year. Various developments such as the negative investment result and rising interest rates and inflation have opposite effects which almost cancel each other out.
For further clarification of how the solvency ratios are determined, refer to the SFCR report (solvency and financial condition) provided on the DELA website.
5.8 Provisions
Developments
| Amounts x €1,000 | Book value 31-12-2021 | Allocation | Withdrawal | Other value mutations | Book value 31-12-2022 |
|---|---|---|---|---|---|
| Provision for deferred tax obligations | 191,876 | 30,791 | -223,305 | 8,584 | 7,946 |
| Provision for pensions | 66 | - | -6 | - | 60 |
| Provision for work anniversaries | 1,755 | 79 | -511 | - | 1,323 |
| Provision for restructuring | 12,625 | 1,738 | -12,919 | -1,444 | - |
| Other provisions | 563 | 224 | -69 | -416 | 302 |
| Total | 206,885 | 32,832 | -236,810 | 6,724 | 9,631 |
The provisions are mainly of a long-term nature.
The deferred tax positions are subjected to offsetting (where possible). The table below shows a specification of the various deferred positions that are presented jointly on the liabilities side of the balance sheet, which also include negative amounts due to the offsetting applied.
Deferred taxes, specification
| Amounts x €1,000 | 31-12-2022 | 31-12-2021 | |||
|---|---|---|---|---|---|
| Related to different tax valuations for: | |||||
| - technical provision | - | -138,482 | |||
| - real estate | -348 | 152,939 | |||
| - loss set-off for previous years | -16,625 | -12,725 | |||
| - initial expenses | 15,309 | -23,240 | |||
| - securities | 7,581 | 209,507 | |||
| - other | 2,029 | 3,877 | |||
| Total | 7,946 | 191,876 |
5.9 Technical provision
Specification
| Amounts x €1,000 | 31-12-2022 | 31-12-2021 | |||
|---|---|---|---|---|---|
| Gross technical provisions | 7,663,848 | 7,292,420 | |||
| Reinsurance share | -25,281 | -23,630 | |||
| Allocated acquisition costs | -106,833 | -96,478 | |||
| Total | 7,531,734 | 7,172,312 |
Technical provision, developments
| Amounts x €1,000 | 2022 | 2021 | |||
|---|---|---|---|---|---|
| Book value on 1 January | 7,172,311 | 5,154,718 | |||
| - From premiums | 523,206 | 462,962 | |||
| - Interest | 178,840 | 160,075 | |||
| - Profit sharing | 43,654 | 5,844 | |||
| - Benefits | -201,332 | -166,418 | |||
| - Risk premium | -175,760 | -151,533 | |||
| - Release for expenses | -17,914 | -13,477 | |||
| - Other changes | -898 | -3,308 | |||
| - Allocated acquisition costs | -10,355 | -12,421 | |||
| - Acquisition | 19,982 | 1,735,870 | |||
| Book value on 31 December | 7,531,734 | 7,172,312 |
Almost the entire technical provision can be considered long-term. The modified duration is 35.2. The indexation provision and the provision for compensating the indexation deficit for package policies are part of the technical provision. The value of these provisions on 31 December 2022 was €53.0 million (2021: €57.7 million) respectively €21.7 million (2021: €22.4 million). The decrease of these provisions is mainly due to owners of package policies being awarded indexation respectively the compensation for the indexation shortages for pay-outs upon death in 2022.
The share of reinsurers in the technical provision and the payments to which DELA Group is liable as a result of its reinsurance contracts are deducted from the gross technical provision.
The provisions for life risk are initially based on base tariffs, which are usually mortality rates, a fixed actuarial interest and cost parameters for initial and ongoing costs.
Financial metrics life insurance 2022
| Amounts x €1,000 | Annual premium | Insured capital | Accumulated balance | Provision insurance obligations | Number of insured |
|---|---|---|---|---|---|
| Funeral insurance | 589,388 | 28,904,875 | - | 7,100,925 | 4,928,579 |
| Savings insurance | 43,465 | 506,381 | 460,401 | 460,401 | 55,136 |
| Life insurance | 57,527 | 43,558,706 | - | 102,522 | 505,747 |
| Reinsurance | - | - | - | -25,281 | - |
| Allocated acquisition costs | - | - | - | -106,833 | - |
| Total | 690,380 | 72,969,962 | 460,401 | 7,531,734 | 5,489,462 |
The increase in the annual premium and the insured capital is mainly due to the acquisition of the insurance portfolio in Germany.
Financial metrics life insurance 2021
| Amounts x €1,000 | Annual premium | Insured capital | Accumulated balance | Provision insurance obligations | Number of insured |
|---|---|---|---|---|---|
| Funeral insurance | 520,610 | 26,807,901 | - | 6,806,756 | 4,881,135 |
| Savings insurance | 41,113 | 440,148 | 400,194 | 400,194 | 52,262 |
| Life insurance | 53,438 | 41,429,648 | - | 85,469 | 366,694 |
| Reinsurance | - | - | - | -23,630 | - |
| Allocated acquisition costs | - | - | - | -96,478 | - |
| Total | 615,161 | 68,677,697 | 400,194 | 7,172,312 | 5,300,091 |
Allocated acquisition costs, developments
| Amounts x €1,000 | 2022 | 2021 | |||
|---|---|---|---|---|---|
| Book value on 1 January | 96,478 | 84,057 | |||
| Allocated | 26,126 | 26,157 | |||
| Depreciated | -15,771 | -13,736 | |||
| Book value on 31 December | 106,833 | 96,478 |
The allocation of acquisition costs relates to paid provisions in Belgium and Germany. For the Dutch insurance portfolio, depreciation only took place on paid provision prior to 1 January 2013.
5.10 Liability adequacy test
The liability adequacy test checks that the technical provision is sufficient to provide a high level of certainty regarding the obligations to policyholders. In the test, the balance sheet provision is reduced by the related allocated acquisition costs, and intangible assets are compared to a provision that takes current estimates of all future cashflows and developments into account. These cashflows include profit sharing and premium measures. The current estimates take into account the uncertainty margins prescribed in Guideline 605 of the Dutch Accounting Standards Board.
Should the current estimate be lower than the available technical provision, it can be stated that the available balance sheet provision is able to meet the obligations to policyholders.
The liability adequacy test is performed on the total portfolio of insurance obligations every year. Any shortfalls are charged directly to the income statement, initially by writing them off to future profit margins in acquired portfolios, followed – if necessary – by writing them off to allocated acquisition costs and, finally, by establishing an additional provision if required. Write-offs to allocated acquisition costs or future profit margins in acquired portfolios due to this test are not reversed in later years. No write-offs took place in previous years.
Assumptions liability adequacy test
| Discount rate | Based on the interest rate term structure published by EIOPA, taking into account the Ultimate Forward Rate (UFR) on 31 December 2022. | ||||
| Profit sharing | Full profit sharing occurs when the coverage, or the market value of the investments expressed in percentages of the market value of the already allocated obligations, is higher than 210 percent. No profit share is given if the coverage is 120 percent or lower. Profit sharing is realised pro rata between 120 and 210 percent. | ||||
| Premium measure | An extra premium measure is required if both the 20-year swap interest in accordance with the interest rate term structure as described above is lower than 1 percent and the coverage is lower than 120 percent. The extra premium increase attains the maximum value at an interest rate of -1 percent. | ||||
| Expected mortality | Based on the mortality table 2022 published by the Actuarial Society of the Netherlands, the mortality table 2020 by the Institute of Actuaries in Belgium and the mortality table 2008T by the German Actuarial Society. The mortality rates from these tables are corrected based on portfolio statistics. | ||||
| Unnatural deaths | Risks per homogenous risk group based on own portfolio. | ||||
| Costs | The costs for each coverage for the Netherlands and Belgium are determined based on the 2023 budget and the investment costs associated with the expected investment mix in 2023. | ||||
| Guarantees | Fair value. |
An adjustment was made to the models after an inaccuracy was found which means that the excess value at the end of 2021 was changed to €608 million (including VOBA and mortgage excess value). See also the notes on section 4.1.1. The performed liability adequacy test at current value shows that the total of the technical provisions has an excess value of €2,341 million at the end of 2022. Due to the interest rate rise in 2022 and the excess value shown in the liability adequacy test went up. The results from the test are at the level of DELA Natura- en levensverzekeringen NV (including the Belgian and German offices).
5.11 Long-term liabilities
Specification
| Amounts x €1,000 | 31-12-2022 | 31-12-2021 | |||
|---|---|---|---|---|---|
| Deposit reinsurers | 18,462 | 17,359 | |||
| Deposit fund | 139,941 | 141,548 | |||
| Long-term loans payable externally | 8,948 | 12,332 | |||
| Other | 1,208 | - | |||
| Long-term liabilities | 168,559 | 171,239 |
The ‘Other’ category includes a long-term obligation based on a loss-making contract.
5.11.1 Deposit reinsurers
The liabilities to reinsurers are part of an arrangement and are of a long-term nature. The reinsurers are obligated to deposit the reinsured interest in cash to the insurers of DELA Group. The deposit is subject to an interest of 3 percent to 4.5 percent a year (2021: 3 percent to 4.5 percent).
Deposit reinsurers, developments
| Amounts x €1,000 | 2022 | 2021 | |||
|---|---|---|---|---|---|
| Balance on 1 January | 17,359 | 16,179 | |||
| Received deposits | 1,103 | 1,180 | |||
| Book value on 31 december | 18,462 | 17,359 |
5.11.2 Deposit fund
This involves deposits by clients for future funeral services that are paid out at time of death. This item is therefore mainly of a long-term nature.
Debts resulting from the deposit fund, developments
| Amounts x €1,000 | 2022 | 2021 | |||
|---|---|---|---|---|---|
| Balance on 1 January | 141,547 | 137,111 | |||
| Added interest | 3,756 | 3,549 | |||
| Received deposits | 5,346 | 3,784 | |||
| Surrendered policies | -744 | -1,139 | |||
| Procurement due to acquisitions | - | 7,419 | |||
| Payments | -9,964 | -9,176 | |||
| Book value on 31 December | 139,941 | 141,548 |
The interest rate over the DELA deposit fund is based annually on the ECB deposit interest on 31 December of the relevant year plus 0.75 percent, with a minimum of 1.5 percent to 3.0 percent a year depending on the starting date and deposited amount.
A deposit fund was also acquired as part of the Yarden acquisition in 2021 (accounted for under 'Procurement due to acquisitions’). The interest rate for these deposits in 2022 was 0,01 percent (2021: 0,01 percent).
5.11.3 Monetary loans
This involves loans entered into by subsidiaries with applicable interest rates ranging from 1 percent to 2 percent.
Monetary loans, developments
| Amounts x €1,000 | 2022 | 2021 | |||
|---|---|---|---|---|---|
| Balance on 1 January | 12,332 | 10,008 | |||
| Procurement due to acquisitions | 74 | 25,508 | |||
| Payments | -3,458 | -23,184 | |||
| Book value on 31 December | 8,948 | 12,332 |
Of the monetary loans, €303 has a term of less than one year, €1,153 a term of between 1 and 5 years, and €7,492 a term of more than 5 years.
5.12 Short-term debts
Specification
| Amounts x €1,000 | 31-12-2022 | 31-12-2021 | |||
|---|---|---|---|---|---|
| Advance premiums | 68,371 | 68,012 | |||
| Creditors | 9,229 | 23,732 | |||
| Corporate tax | 26,371 | 103,714 | |||
| Other taxes and social secuirty costs | 4,435 | 13,316 | |||
| Future payments | 67,796 | 58,347 | |||
| Short-term share of long-term liabilities | 98 | 72 | |||
| Derivative financial tools | - | 40,841 | |||
| Other debts and accrued liabilities | 58,335 | 40,343 | |||
| Book value on 31 December | 234,635 | 348,377 |
Derivative financial instruments
The derivative financial instruments on 31 December 2021 included forward exchange contracts. There were also derivatives (foreign exchange contracts) in place on 31 December 2022 but their value was positive so they were classified on the asset side under other investments.
Grave maintenance (included in the itemOther debts and accrued liabilities)
The accrual (amount: €7,252) is determined based on the advance received income resulting from contracts relating to the maintenance of graves and the expected future loss on the maintenance contracts existing on the balance sheet date. Old contracts are depreciated linearly over a term of 15 years. New contracts are depreciated in accordance with the contract term.
5.13 Assets and obligations not included in the balance sheet
5.13.1 Lightyear - Atlas Technologies B.V.
DELA Group has a convertible loan of €30.0 million with a term until 1 July 2024 with Lightyear - Atlas Technologies BV at an interest rate of 6% a year. The security on this loan consists of a pledge on the IP portfolio (patents and the like). Unfortunately, Atlas Technologies was declared bankrupt on 27 January 2023. The bankruptcy was being concluded as this financial statements was being drawn up.
The company will be relaunched in a slimmed down form, and the loan has been converted into an equity interest in the newly founded company. The current situation remains sufficiently unclear that a fair valuation hereof cannot be reliably made. This means that the processing criteria for an asset in the financial statements cannot be met as it must be possible for the value of an asset to be reliably determined. With this in mind the asset has not been included on the balance sheet for 31 December 2022.
5.13.2 Liability
DELA cooperative has issued a liability statement for most of the subsidiaries involved in the consolidation as referred to in Article 2:403 DCC. The subsidiaries involved are included in section 1.2.
5.13.3 Terrorism guarantee
Participation in the Dutch Terrorism Claims Reinsurance Company (NHT) entails a conditional obligation for compensation for acts of terrorism with a value of up to €2.1 million. No terrorist act as meant by this agreement occurred in the book year.
5.13.4 Bank guarantees
DELA Group has issued a total of €0.2 million in bank guarantees. These were mainly issued for rental contracts with external parties.
5.13.5 Multi-year financial obligations
Specification
| Amounts x €1,000 | Less than one year | Between one and five years | Longer than five years | ||
|---|---|---|---|---|---|
| Rent obligations | 4,660 | 14,066 | 3,942 | ||
| Lease obligations | 4,015 | 6,873 | 1 |
5.13.6 Credit facilities
DELA Group has a credit facility at Northern Trust with a maximum of €100 million or 10 percent of the value of the securities deposited. The collateral comprises the securities in custody with Northern Trust. The interest percentage due is the ESTER interest rate plus 1.25 percent.
DELA Group has a credit facility at Rabobank with a maximum of €4 million. The interest percentage due is the EONIA interest rate plus 1.6 percent.
5.13.7 Investment obligation
DELA Group came to an agreement with a counterparty in 2022 to invest €100 million in real estate funds. At the end of 2022 the remaining investment obligations to various counterparties were €100 million and $62 million (which equals €58 million on the balance sheet date).
In 2022 DELA Group did not enter into any new agreements for investments in infrastructure funds. At the end of 2022 the remaining investment obligations were €30 million and $80 million (which equals €74 million on the balance sheet date).
At the end of 2022 the remaining investment obligation in ASR Hypotheekfonds was €75 million.
DELA Group came to an agreement with a counterparty in 2022 to invest €100 million in agricultural and forestry funds. At the end of 2022 the remaining investment obligations were €131 million and $80 million (which equals €74 million on the balance sheet date).
5.13.8 Future contractual rental income
DELA Group is entitled to future rental income as a result of ongoing rental agreements.
Future contractual rental income
| Amounts x €1,000 | Less than one year | Between one and five years | Longer than five years | ||
|---|---|---|---|---|---|
| Rental income | 13,117 | 24,857 | 2,497 |
5.13.9 Fiscal unity
Fiscal units have been established in DELA Group for corporate tax (VPB) and turnover tax (OB) in both the Netherlands and Belgium. Every company within the tax unity is severally liable for the taxes due. The table below shows the composition of these tax entities:
Composition of tax entities
| Corporate Tax Netherlands | Turnover tax Netherlands | Corporate Tax Belgium | Turnover tax Belgium | ||
|---|---|---|---|---|---|
| DELA Coöperatie U.A. | Yes | Yes | No | No | |
| DELA Holding N.V. | Yes | Yes | No | No | |
| DELA Natura- en levensverzekeringen N.V. | Yes | Yes | No | No | |
| DELA Vastgoed B.V. | Yes | Yes | No | No | |
| DELA Hypotheken B.V. | Yes | Yes | No | No | |
| DELA Crematoria Groep B.V. | Yes | Yes | No | No | |
| DomusDELA Vastgoed B.V. | Yes | Yes | No | No | |
| DomusDELA Klooster B.V. | Yes | Yes | No | No | |
| DomusDELA Exploitatie B.V. | Yes | Yes | No | No | |
| DELA Uitvaartverzorging N.V. | Yes | Yes | No | No | |
| DELA Depositofonds B.V. | Yes | Yes | No | No | |
| DELA US Investments B.V. | Yes | Yes | No | No | |
| Begraafbeheer B.V. | Yes | Yes | No | No | |
| DELA Depositary & Asset Management B.V. | Yes | Yes | No | No | |
| Yarden Franchise B.V. | Yes | Yes | No | No | |
| Voor Elkaar Holding B.V. | Yes | Yes | No | No | |
| Fello B.V. | Yes | Yes | No | No | |
| UNC Holding B.V. | No | No | No | No | |
| Crematorium La Grande Suisse B.V. | No | No | No | No | |
| Exploitatie crematorium La Grande Suisse B.V. | No | No | No | No | |
| Begraafplaatsen & Crematorium Almere B.V | No | No | No | No | |
| Exploitatie Maatschappij Yarden - Eefting B.V. | No | No | No | No | |
| Uitvaartcentrum Zwolle B.V. | No | No | No | No | |
| Tempero B.V. | No | No | No | No | |
| C.V.U. Uitvaartzorg B.V. | No | No | No | No | |
| DELA Holding Belgium NV | No | No | Yes | Yes | |
| Crematorium Brugge N.V. | No | No | Yes | Yes | |
| Crematorium Vilvoorde N.V. | No | No | Yes | Yes | |
| Hainaut Crémation SA | No | No | No | Yes | |
| DELA Funerals Assistance 1 BVBA | No | No | No | Yes | |
| DELA Natura-en levensverzekeringen N.V. filiaal België | No | No | Yes | Yes | |
| DELA Vastgoed België N.V. | No | No | No | Yes | |
| DELA Enterprise N.V. | No | No | Yes | Yes | |
| DELA Investment Belgium N.V. | No | No | Yes | No |
6. Notes on the income statement
6.1 Income
Specification
| Amounts x €1,000 | 2022 | 2021 | |||
|---|---|---|---|---|---|
| Premium revenu | |||||
| Premium revenue Netherlands | 487,609 | 434,518 | |||
| Premium revenue Belgium | 146,089 | 136,258 | |||
| Premium revenue Germany | 35,313 | 21,696 | |||
| 669,011 | 592,472 | ||||
| Turnover funeral company | |||||
| Turnover funeral company Netherlands | 303,408 | 258,431 | |||
| Turnover funeral company Belgium | 66,541 | 59,292 | |||
| 369,949 | 317,723 | ||||
| Internal turnover | -178,173 | -161,202 | |||
| 191,776 | 156,521 | ||||
| Income from investments | -805,658 | 685,295 | |||
| Other insurer turnover | 39 | 3,236 | |||
| Total | 55,168 | 1,437,524 |
Of the total premium income in 2022, €11.6 million consists of single premiums (2021: €15.4 million).
6.2 Net investment result
Realised and unrealised investment result, specification 2022
| Amounts x €1,000 | Realised profit | Realised loss | Unrealised result | Asset management costs | Total |
|---|---|---|---|---|---|
| Real estate (a) | 24,639 | - | -13,273 | 18,997 | -7,631 |
| Participations (b) | 471 | -44 | - | - | 515 |
| Other financial investments (c): | |||||
| - Shares and other variable income securities | 453,644 | 203,652 | -619,164 | 5,912 | -375,084 |
| - Bonds and other fixed-income securities | 171,340 | 224,229 | -364,846 | 4,003 | -421,738 |
| - Derivatives | 73,925 | 304,021 | 105,416 | 436 | -125,116 |
| - Mortgage loans | 6,718 | - | - | 946 | 5,772 |
| - Other loans | 17,894 | 7,784 | -24,712 | 1,149 | -15,751 |
| - Real estate funds | 50,112 | 439 | 29,192 | 337 | 78,528 |
| - Infrastructure funds | 28,528 | - | 50,048 | 242 | 78,334 |
| - Agricultural and forestry funds | - | - | -660 | - | -660 |
| - Mortgage funds | 4,093 | -304 | -58,310 | - | -53,913 |
| - Other financial investments | 64 | 308 | -692 | 3,787 | -4,724 |
| 806,318 | 740,129 | -883,728 | 16,812 | -834,351 | |
| Net investment result (a) + (b) + (c) | 831,428 | 740,085 | -897,001 | 35,809 | -841,467 |
Realised and unrealised investment result, specification 2021
| Amounts x €1,000 | Realised profit | Realised loss | Unrealised result | Asset management costs | Total |
|---|---|---|---|---|---|
| Real estate (a) | 29,028 | - | -26,234 | 21,054 | -18,261 |
| Participations (b) | 13 | -1 | - | - | 14 |
| Other financial investments (c): | |||||
| - Shares and other variable income securities | 325,919 | 73,607 | 231,453 | 5,837 | 477,928 |
| - Bonds and other fixed-income securities | 359,457 | 69,446 | -260,445 | 4,572 | 24,994 |
| - Derivatives | 59,452 | 117,143 | -76,657 | 409 | -134,757 |
| - Mortgage loans | 8,374 | - | - | 701 | 7,673 |
| - Other loans | 20,526 | 2,171 | 7,457 | 1,310 | 24,502 |
| - Real estate funds | 29,376 | 608 | 157,890 | 2,422 | 184,236 |
| - Infrastructure funds | 11,366 | - | 65,982 | -965 | 78,313 |
| - Mortgage funds | 448 | - | 2,900 | -18 | 3,366 |
| - Other financial investments | 2,070 | 15 | -90 | 3,553 | -1,588 |
| 816,988 | 262,990 | 128,490 | 17,821 | 664,667 | |
| Net investment result (a) + (b) + (c) | 846,028 | 262,989 | 102,256 | 38,875 | 646,420 |
Unrealised results indicate changes to the market value of the investments (including currency exchange effects) in the book year as they stand on the balance sheet date. All other investment results are attributed to the realised investment results.
Direct and indirect investment result, specification 2022
| Amounts x €1,000 | Direct | Indirect | Total |
|---|---|---|---|
| Real estate (a) | -2,130 | -5,501 | -7,631 |
| Participations (b) | 515 | - | 515 |
| Other financial investments (c): | |||
| - Shares and other variable income securities | 61,113 | -436,197 | -375,084 |
| - Bonds and other fixed-income securities | 81,707 | -503,445 | -421,738 |
| - Derivatives | -436 | -124,680 | -125,116 |
| - Mortgage loans | 5,772 | - | 5,772 |
| - Other loans | 14,198 | -29,949 | -15,751 |
| - Real estate funds | 49,720 | 28,808 | 78,528 |
| - Infrastructure funds | 28,528 | 49,806 | 78,334 |
| - Agricultural and forestry funds | - | -660 | -660 |
| - Infrastructure funds | 4,402 | -58,314 | -53,912 |
| - Other financial investments | -1,843 | -2,881 | -4,724 |
| 243,161 | -1,077,512 | -834,351 | |
| Net investment result (a) + (b) + (c) | 241,546 | -1,083,013 | -841,467 |
Direct and indirect investment result, specification 2021
| Amounts x €1,000 | Direct | Indirect | Totaal |
| Real estate (a) | 11,305 | -29,565 | -18,261 |
| Participations (b) | 14 | - | 14 |
| Other financial investments (c): | |||
| - Shares and other variable income securities | 53,757 | 424,171 | 477,928 |
| - Bonds and other fixed-income securities | 68,493 | -43,499 | 24,994 |
| - Derivatives | -409 | -134,348 | -134,757 |
| - Mortgage loans | 7,673 | - | 7,673 |
| - Other loans | 13,620 | 10,882 | 24,502 |
| - Real estate funds | 29,350 | 154,886 | 184,236 |
| - Infrastructure funds | 10,960 | 67,353 | 78,313 |
| - Mortgage funds | 314 | 3,052 | 3,366 |
| - Other financial investments | -3,212 | 1,624 | -1,588 |
| 180,546 | 484,121 | 664,667 | |
| Net investment result (a) + (b) + (c) | 191,864 | 454,556 | 646,420 |
Direct investment results include all received rental, lease and dividend income minus all investment costs. All results – both realised and unrealised – that result from market value changes are attributed to the indirect investment results.
6.3 Underwriting costs
Specification
| Amounts x €1,000 | 2022 | 2021 | |||
|---|---|---|---|---|---|
| Payment on death | 64,813 | 36,575 | |||
| Funeral costs | 133,807 | 131,208 | |||
| Expiration | 4,028 | 3,230 | |||
| Pension insurance payment | 11 | 12 | |||
| Capital payments | 70,877 | 67,164 | |||
| Annulment payments | 312 | 288 | |||
| Surrendered policies | 36,012 | 23,995 | |||
| Technical provisions allocation | 306,142 | 288,104 | |||
| Intercompany payments insurer to funeral company | -178,173 | -161,202 | |||
| Total | 437,829 | 389,374 |
6.4 Acquisition costs
Specification
| Amounts x €1,000 | 2022 | 2021 | |||
|---|---|---|---|---|---|
| Direct acquisition costs | 28,101 | 27,519 | |||
| Allocated acquisition costs | -26,126 | -25,961 | |||
| Depreciation of acquisition costs | 15,771 | 13,736 | |||
| Total | 17,746 | 15,294 |
The acquisition costs involve provisions paid to third parties.
6.5 Personnel costs
Personnel costs, specification
| Amounts x €1,000 | 2022 | 2021 | |||
|---|---|---|---|---|---|
| Salaries | 133,630 | 113,589 | |||
| Social security costs | 25,672 | 19,506 | |||
| Pension costs | 17,904 | 14,687 | |||
| Outsourced work | 41,432 | 34,137 | |||
| Other personnel costs | 17,496 | 10,344 | |||
| Total | 236,134 | 192,263 |
6.6 Depreciation of and other value changes to intangible and tangible fixed assets costs
Specification
| Amounts x €1,000 | 2022 | 2021 | |||
|---|---|---|---|---|---|
| Depreciation of intangible fixed assets | 29,725 | 21,279 | |||
| Depreciation of tangible fixed assets | 11,652 | 11,342 | |||
| Total | 41,377 | 32,621 |
6.7 Other operating costs
Specification
| Amounts x €1,000 | 2022 | 2021 | |||
|---|---|---|---|---|---|
| Building and inventory | 22,548 | 23,451 | |||
| Vehicle costs | 8,705 | 6,663 | |||
| ICT costs | 31,467 | 25,486 | |||
| Advertising costs | 24,331 | 23,023 | |||
| Third-party services | 28,473 | 20,691 | |||
| Office costs | 10,587 | 9,726 | |||
| Incidental income | -16,168 | -10,769 | |||
| Incidental costs | 4,710 | 1,595 | |||
| Donation to Stichting DELA Fonds | 602 | 468 | |||
| Other costs | 299 | 462 | |||
| Minus: activation of software systems | -11,545 | -13,642 | |||
| Total | 104,009 | 87,154 |
The incidental costs comprise the costs for the 85-year anniversary, partially compensated for by a reduction in costs due to the definitive calculation of the pro rata VAT percentage.
The incidental income mainly the release of negative goodwill related to the acquisition of the Monuta portfolio in Germany. The incidental income in 2021 also included recovered VAT over previous years as well as the sale of the Hasselt crematorium (€5.4 million).
6.8 Remuneration Executive and Supervisory Board members
Executive Board members are remunerated via a fixed and a variable component. They do not receive any representation fee or shares or bonds. Of the variable component (no more than 20 percent) 60 percent is paid unconditionally and 40 percent conditionally. Both parts are fully paid in cash. The retention period for the conditional part is three years. The remuneration of the Executive Board members in the book year comprised a fixed component of €1,142 (2021: €1,148), a variable component of €180 (2021: €170) and a pension contribution of €241 (2021: €217).
The remuneration of the Supervisory Board members (of DELA Coöperatie U.A., DELA Holding NV and DELA Natura- en levensverzekeringen NV together) in the book year amounted to €268 (2021: €246).
6.9 Audit fees
The fee for auditing the financial statements involves the total fee for the book year to which the financial statements relates, regardless of whether the activities were already performed by the external accountant during the book year. In this book year and the previous, the following amounts in accountancy costs were charged to the result:
Audit fees 2022
| Amounts x €1,000 | Deloitte NL | Deloitte abroad | Total Deloitte | ||
|---|---|---|---|---|---|
| Audit of the financial statements | 853 | 264 | 1,117 | ||
| Other audit engagements | 232 | - | 232 | ||
| Total | 1,085 | 264 | 1,349 |
Audit fees 2021
| Amounts x €1,000 | Deloitte NL | Deloitte abroad | Total Deloitte | ||
|---|---|---|---|---|---|
| Audit of the financial statements | 850 | 248 | 1,098 | ||
| Other audit engagements | 134 | - | 134 | ||
| Total | 984 | 248 | 1,232 |
The aforementioned fees involve the activities performed at DELA Group by audit firms and independent external accountants as referred to in Article 1, section 1 of the Accounting Organisations (Supervision) Act (Wta) and the charged fees of the entire network of which the audit firm is part. The other auditing activities mainly involve checking the annual statements for the supervisor. In addition, extra work was carried out for the model adjustment implemented within DELA. The amounts are exclusive of sales tax.
6.10 Taxes on results from ordinary activities
The taxes on the negative results before tax to the amount of € 1.015.079 can be clarified as follows:
Taxes on results, specification
| Amounts x €1,000 | 2022 | 2021 | |||
|---|---|---|---|---|---|
| Corporate tax due in reporting year | 26,126 | 97,288 | |||
| Previous years | -10,990 | -1,603 | |||
| Acute corporate income tax | 15,136 | 95,685 | |||
| Deferred corporate tax | -288,937 | -5,686 | |||
| Impact of tax percentage change | - | 9,626 | |||
| Total | -273,801 | 99,625 |
The nominal tax rate in the Netherlands in 2022 was 25.8 percent (2021: 25 percent), in Belgium 25 percent (2021: 25 percent), for Germany the applicable nominal rate of 30 percent (2021: 30 percent) was taken into account. As Germany only determines a limited taxable result, this results in a minimal divergence between the applicable rate and the effective tax burden.
Taxes on results, clarification
| Amounts x €1,000 | 2022 | 2021 | |||
|---|---|---|---|---|---|
| Result from ordinary operations before tax | -1,015,079 | 534,312 | |||
| Nominal tax percentage | 25.8% | 25.0% | |||
| Nominal tax amount | -261,890 | 133,578 | |||
| Impact of participation exemption | -43,090 | -20,166 | |||
| Corporate tax previous years | -10,990 | -1,603 | |||
| Tax differences | 42,169 | -12,184 | |||
| Total | -273,801 | 99,625 |
The effective tax burden deviates from the nominal rate. Participation exemptions apply due to interests of over 5 percent in investment funds. Taxes over previous years mainly involve a change in how the participation exemption on an investment fund is applied. The fiscal differences are due to the fact that realised and unrealised losses on shares are not tax-deductible in Belgium. The effective tax rate over 2022 is 27.0 percent (2021: 18.6 percent).
7. Average number of employees
DELA Group had an average of 2,919 (2021: 2,543) employees over 2022, 447 (2021: 440) of which in Belgium and 36 (2021: 26) in Germany. Of these employees, 9 (2021: 12) worked for asset management and real estate management, with the personnel costs of €989 (2021: €1,524) coming under the investment costs.
8. Claims
No material claim is pending by or for DELA Group.
Eindhoven, 21 april 2023
DELA cooperative
The Executive Board
E. (Edzo) Doeve, CEO / chair
J.A.M. (Jack) van der Putten, CCO / vice-chair
J.L.R. (Jon) van Dijk, CFRO
Supervisory Board
J.W.T. (John) van der Steen, chair
J.J.A. (Hans) Leenaars, vice-chair
G.C.A.M. (Frits) van Bree, secretary
W. A.P.J. (Willemien) Caderius van Veen
G.M. (Georgette) Fijneman
G.H.C. (Georges) de Méris
Company-only financial statements
Company-only balance sheet on 31 December 2022
After result appropriation.
| Amounts x €1,000 | Ref. | 31-12-2022 | 31-12-2021 | ||
|---|---|---|---|---|---|
| ASSETS | |||||
| Fixed assets | |||||
| Participations | 10 | 1,026,046 | 1,750,752 | ||
| Receivables from group companies | 11 | 3,500 | 4,375 | ||
| Other investments | 3,027 | 2,764 | |||
| 1,032,573 | 1,757,891 | ||||
| Current assets | |||||
| Receivables from group companies | 11 | 18,254 | - | ||
| Other receivables | 16,519 | 21,749 | |||
| 34,773 | 21,749 | ||||
| Cash and cash equivalents | 12 | 330 | 409 | ||
| TOTAL ASSETS | 1,067,676 | 1,780,049 | |||
| LIABILITIES | |||||
| Equity capital | 16 | ||||
| Revaluation reserve | 13 | 437,905 | 387,037 | ||
| Statutory reserves | 14 | 33,200 | 28,198 | ||
| Other reserves | 15 | 566,477 | 1,363,178 | ||
| 1,037,582 | 1,778,413 | ||||
| Short-term debts | |||||
| Debts to group companies | 29,601 | 1,271 | |||
| Other debts | 493 | 365 | |||
| 30,094 | 1,636 | ||||
| TOTAL LIABILITIES | 1,067,676 | 1,780,049 |
Company-only income statement for 2022
| Amounts x €1,000 | 2022 | 2021 | |||
|---|---|---|---|---|---|
| Result of participations after tax | -725,021 | 445,394 | |||
| Company result after tax | -16,080 | -10,513 | |||
| Result after taxes | -741,101 | 434,881 |
Notes on the company-only balance sheet and income statement
9. General
9.1 Principles
The company-only financial statements was drawn up in accordance with the legal stipulations in Title 9 Book 2 DCC and the authoritative statements of the Dutch Accounting Standards for annual reporting, published by the Dutch Council for Annual Reporting.
The principles for valuation and the determination of the results for the company-only financial statements and the consolidated financial statements are the same. As the 2022operational income statement of DELA cooperative has been processed in the consolidated financial statements, only the summarised individual income statement is included in accordance with Article 2:402 DCC. Participations in group companies are valued in accordance with the equity value in compliance with section.5.2 of the consolidated financial statements.
For the principles used in the valuation of assets and liabilities and the result determination, we refer to the clarification in sections 2 and 3 related to the consolidated balance sheet and income statement.
9.2 Comparative figures
The comparative figures from 2021 include the figures from the adopted financial statements 2021.
10. Participations
The participating interests concern a 100% interest in DELA Holding N.V. and a 100% interest in Voor Elkaar HoldingN.V.
Participations, developments
| Amounts x €1,000 | 2022 | 2021 | |||
|---|---|---|---|---|---|
| Balance on 1 January | 1,750,752 | 1,305,077 | |||
| Result of participation | -725,021 | 445,394 | |||
| Paid dividend | 45 | - | |||
| Other value changes | 270 | 281 | |||
| Balance on 31 December | 1,026,046 | 1,750,752 | |||
| Acquisition value | 607,409 | 607,364 | |||
| Cumulative changes | 418,637 | 1,143,388 | |||
| Balance on 31 December | 1,026,046 | 1,750,752 |
11. Receivables
Receivables from group companies, developments
| Amounts x €1,000 | 31-12-2022 | 31-12-2021 | |||
|---|---|---|---|---|---|
| Fixed assets | |||||
| DELA Holding NV | 3,500 | 4,375 | |||
| Current assets | |||||
| DELA Holding NV | 18,254 | - | |||
| Total | 21,754 | 4,375 |
The average balance of these current account relationships is subject to an interest of 0.5 percent (short) and 3.5 percent (long).
12. Cash and cash equivalents
The cash and cash equivalents are freely available to the legal person and consist entirely of bank balances.
13. Revaluation reserve
Developments
| Amounts x €1,000 | 2022 | 2021 | |||
|---|---|---|---|---|---|
| Balance on 1 January | 387,037 | 240,740 | |||
| From other reserves related to change in value of investments without frequent market listing | 98,970 | 174,085 | |||
| To other reserves related to sale of investments without frequent market listing | -48,102 | -27,788 | |||
| Balance on 31 December | 437,905 | 387,037 |
14. Statutory reserves
A statutory reserve has been set at the level of the capitalised expenses of internally developed software systems.
Statutory reserves, developments
| Amounts x €1,000 | 2022 | 2021 | |||
|---|---|---|---|---|---|
| Balance on 1 January | 28,198 | 24,976 | |||
| To other reserves related to release of statutory reserve in participations | -2,562 | -2,949 | |||
| From other reserves related to establishment of statutory reserve in participations | 7,564 | 6,171 | |||
| Balance on 31 December | 33,200 | 28,198 |
15. Other reserves
Developments
| Amounts x €1,000 | 2022 | 2021 | |||
|---|---|---|---|---|---|
| Balance on 1 January | 1,363,178 | 1,077,535 | |||
| From appropriation result book year | -741,101 | 434,881 | |||
| To revaluation reserve related to change in value of investments without frequent market listing | -98,970 | -174,085 | |||
| From revaluation reserve related to sale of investments without frequent market listing | 48,102 | 27,788 | |||
| Establishment of statutory reserve | -5,002 | -3,222 | |||
| Other change in value | 270 | 281 | |||
| Balance on 31 December | 566,477 | 1,363,178 |
16. Statement of changes to own equity
Proposal for the appropriation of the 2022 result
It is proposed that the positive result after tax of €741,101 is added to the other reserves. In anticipation of confirmation by the general meeting, this appropriation has already been processed in the financial statements.
Appropriation of the 2021 result
The financial statements 2021 was confirmed in the general meeting of 11 June 2022. The general meeting determined the appropriation of the result in accordance with the proposal.
Statement of changes in equity
| Amounts x €1,000 | 2022 | 2021 | |||
|---|---|---|---|---|---|
| Balance on 1 January | 1,778,413 | 1,343,251 | |||
| From appropriation result book year | -741,101 | 434,881 | |||
| Other changes in value | 270 | 281 | |||
| Balance on 31 December | 1,037,582 | 1,778,413 |
17. Assets and obligations not included in the balance sheet
DELA cooperative is part of a Dutch fiscal unity for corporation tax (VPB) and turnover tax (OB). Every company within the fiscal unity is severally liable for the taxes due.
18. Average number of employees
DELA Cooperative had 1 employee (2021: 1) in 2022, none of which were abroad (2021: none).
Eindhoven, 21 april 2023
DELA cooperative
The Executive Board
E. (Edzo) Doeve, CEO / chair
J.A.M. (Jack) van der Putten, CCO / vice-chair
J.L.R. (Jon) van Dijk, CFRO
Supervisory Board
J.W.T. (John) van der Steen, chair
J.J.A. (Hans) Leenaars, vice-chair
G.C.A.M. (Frits) van Bree, secretary
W. A.P.J. (Willemien) Caderius van Veen
G.M. (Georgette) Fijneman
G.H.C. (Georges) de Méris